May 14 2020
Preliminary Analysis
Summary
Using Rhode Island age-structured case data, age-structured hospitalization data, as well as ICU and ventilator occupancy data points collected by the Rhode Island Department of Health since March 1 2020, we are able to infer changes in population-mixing patterns over the past two months. We are also able estimate the fraction of symptomatic cases that are observed by the health system, the hospital length-of-stay for non-ICU cases, and the probabilities of progressing to hospitalization or ICU care. By late March, physical contact and social mixing had dropped to 60% of their early March levels; by mid-April mixing was lower than 40% of previous levels. More than half of symptomatic COVID cases in Rhode Island are reported to the health system (posterior median estimate is 71%). Our scenario generation indicates that strong social distancing and physical distancing measures need to be in place for all of May.
Background
Like in many other states, Rhode Island’s Department of Health has been diligently collecting a rich data set that currently spans about 10 weeks of epidemic transmissin of SARS-CoV-2 (COVID). On April 27, our first preliminary analysis indicated that population mixing rates had fallen in Rhode Island by 80% but if recent transmission trends continued the epidemic would re-enter an exponential growth phase (this did not occur). At the time, we assumed that 25% of cases in Rhode Island were reporting to the health system and being confirmed as COVID cases; this was based on a published analysis [version dated 24-04-2020; not peer-reviewed] that suggested that under-reporting in the US was at about a factor of eight (ρ=0.125). We used ρ=0.25 for Rhode Island since the epidemic response seemed to get an earlier start and was better supported than in other states. This approximation for ρ was still too low (see below), and this is one of the reasons that our April 27 forecasts for near-term epidemic trends were overly pessimistic.
Methods
Important details are listed on our Methods Page and in the previous post.
Data for this analysis include case numbers through April 29. We also use data on hospitalization incidence, current hospitalization numbers, current ICU occupancy, and the number of ICU patients currently on ventilators.
Daily β-values (population mixing parameters) were modeled using cubic-spline basis functions as before. A negative binomial observation function with a reporting rate ρ was used to model the observation probability of daily case counts, using the mean incidence predicted by the ODE model.
Probabilities of hospitalization, progressing to the ICU, and needing mechanical ventilation were approximated by using available data from the literature (summarized here). For some of these probabilities we included a deviation parameter in the statistical estimation to determine if these probabilities were higher or lower in RI than estimated previously. There was not enough data to estimate these deviation parameters for each age group, so some deviation parameters were defined for all ages (thus preserving the relative probabilities among age groups) and some were defined for a coarser age grouping.
Results
Parameter Estimation
Posterior distributions for daily β-parameters were rescaled by the mean β-value between March 1 and March 10, representing the first ten days of the known epidemic in Rhode Island, but before any social distancting recommendations/requirements were put into place. Figure 1 shows the posterior distribution of all 60 relative mixing parameters from March 1 to April 29. By late March, population-level mixing and contact patterns had dropped by about 40% when comparing to their early March levels. By mid-April, this reduction was more than 60%. An LSTMH analysis shows a 50% contact level reduction in Rhode Island from March 9 to late April; our estimate for this time period is around 67%.
Note the larger amount of uncertainty in the β-parameters when compared to our April 27 preliminary analysis. The reason for this is that inclusion of the hospitalization, ICU, and ventilator data does not allow the case reporting data to completely determine the β-values.
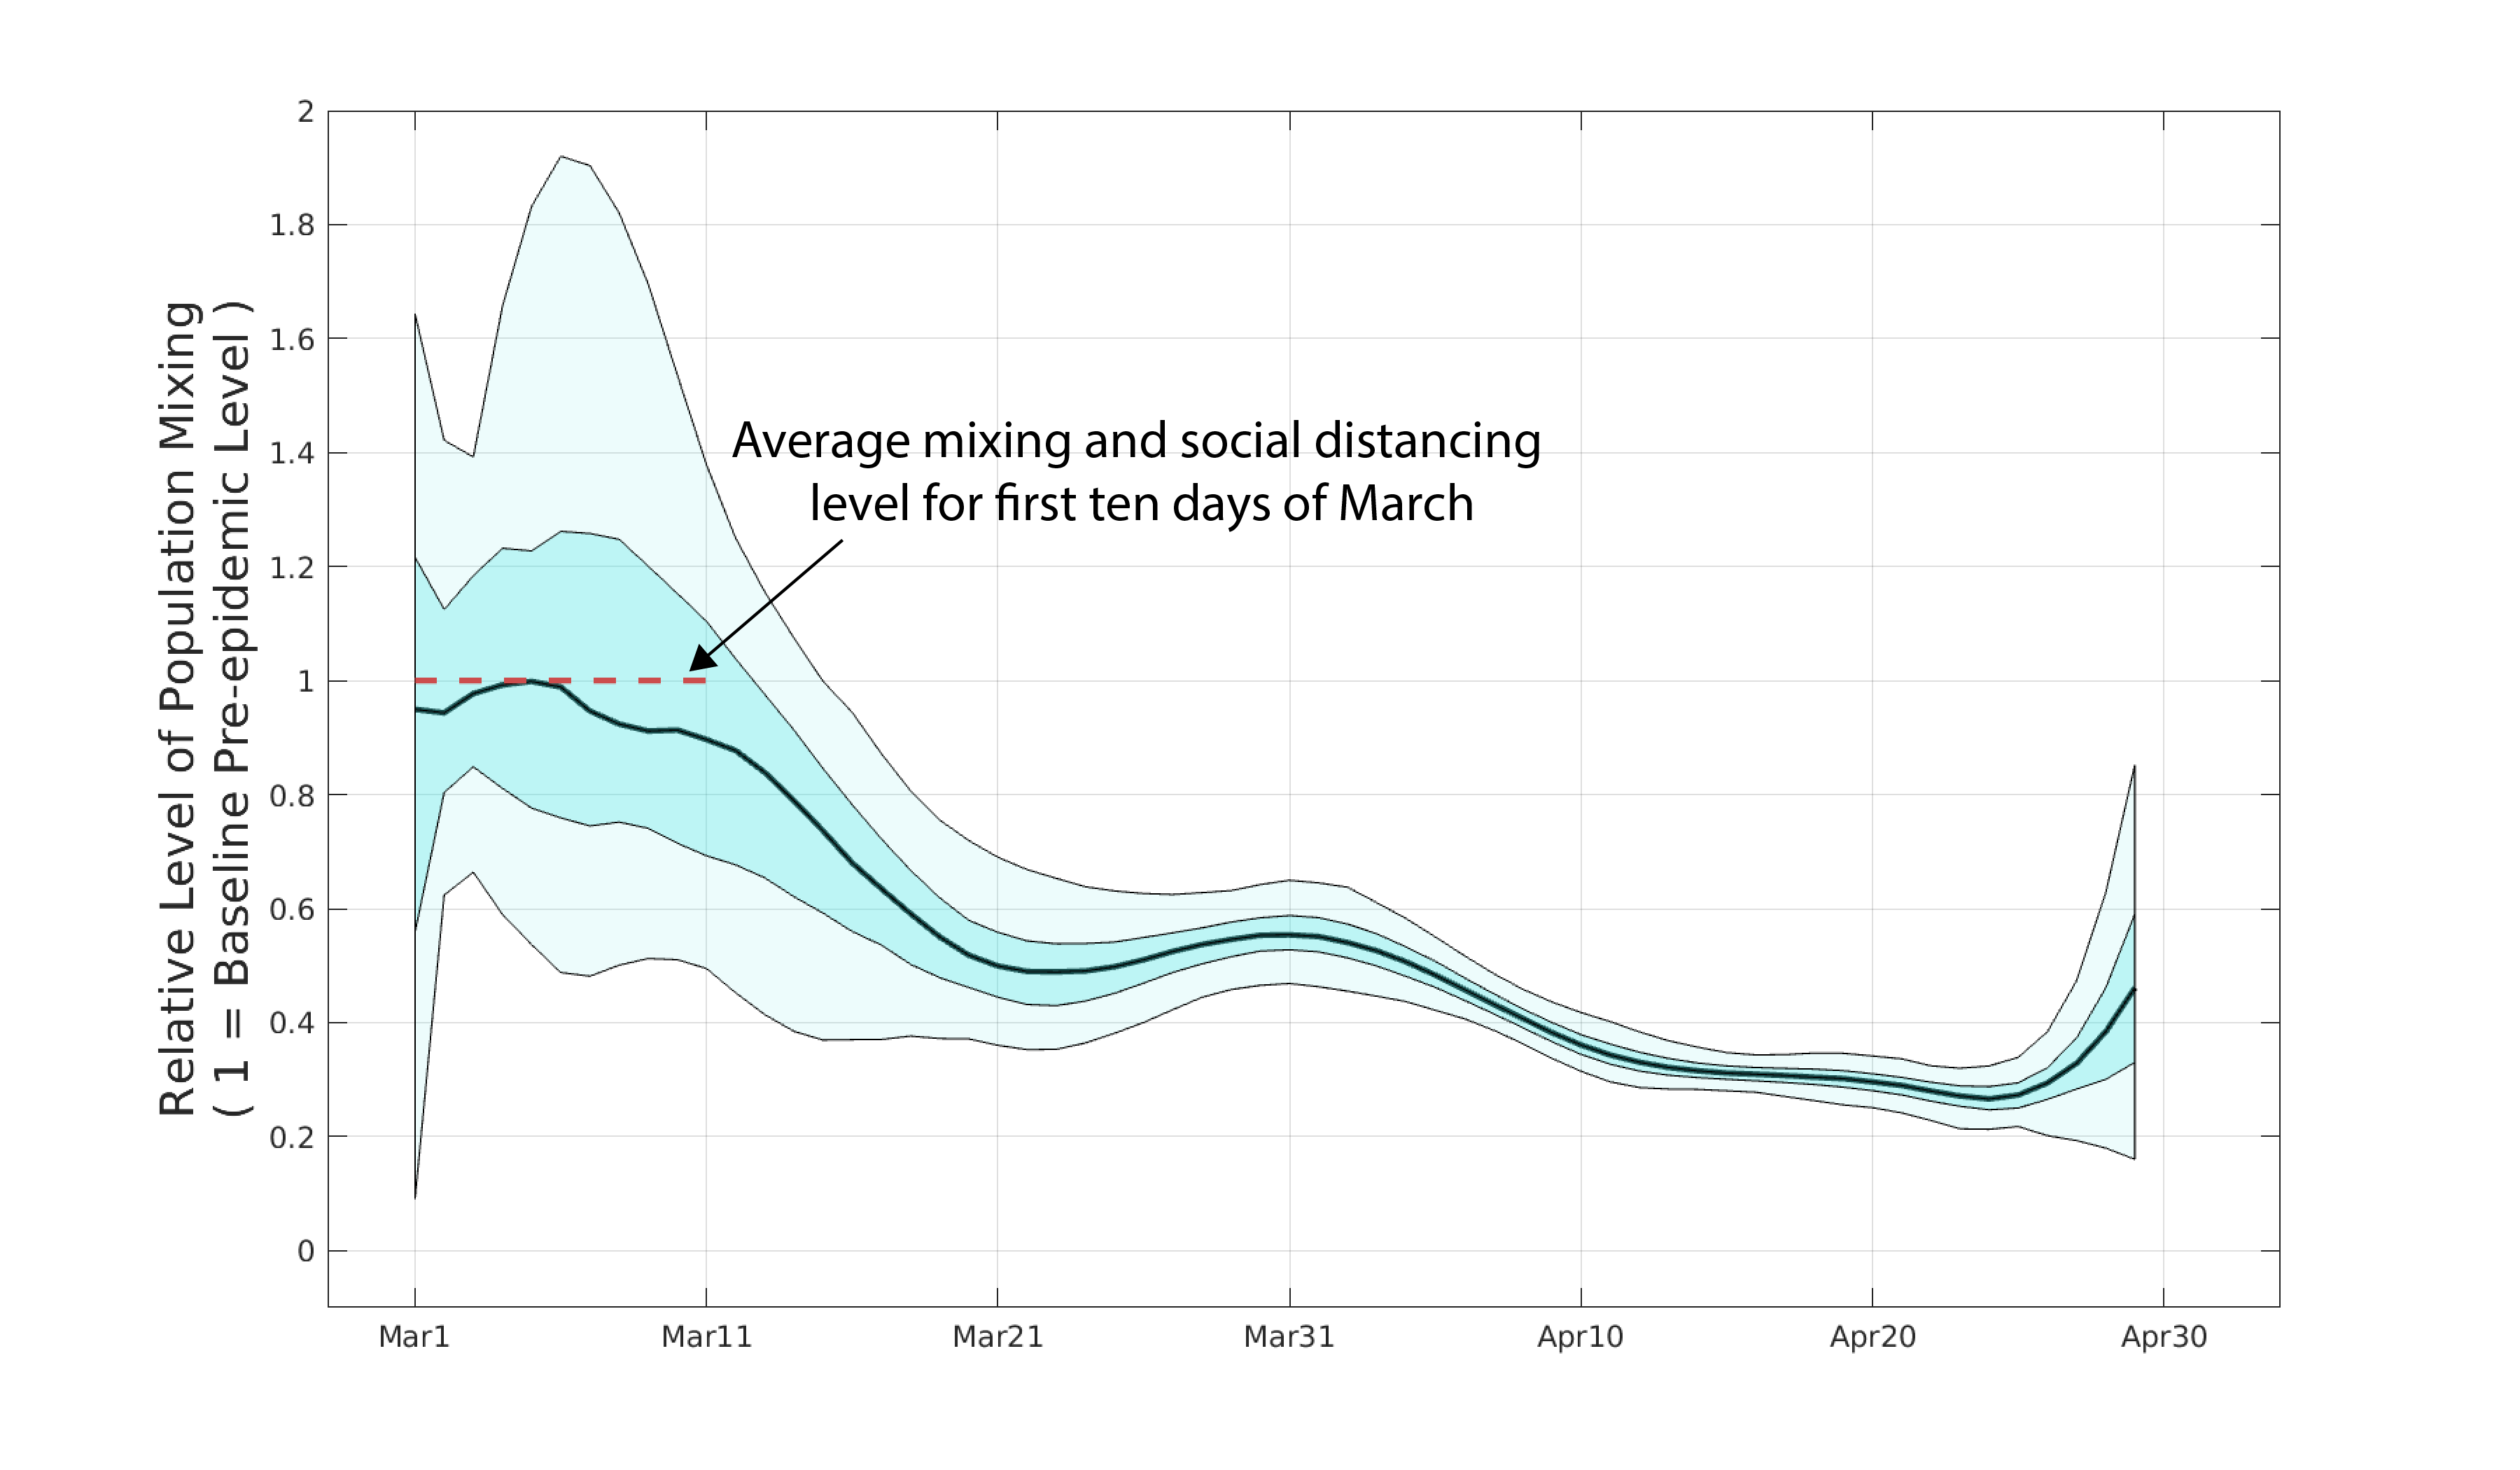
Figure 1. Posterior distribution for daily β-parameters that represent mixing and social/physical contact in the population. The black line is the posterior median relative β-value. The darker shaded region shows the posteriors’ interquartile range and the lighter shaded region shows the 95% credible interval.
Using the delay from case presentation to hospitalization, we were able to estimate the reporting rate ρ in our observation function. The fraction of all symptomatic cases that are seen and counted by the health system is ρ=0.71 (posterior median) with an uncertainty range expressed as 95% highest posterior density (HPD) from 0.46 to 1.0. This means that more than 45% of of all symptomatic cases in Rhode Island are reported to the health system.
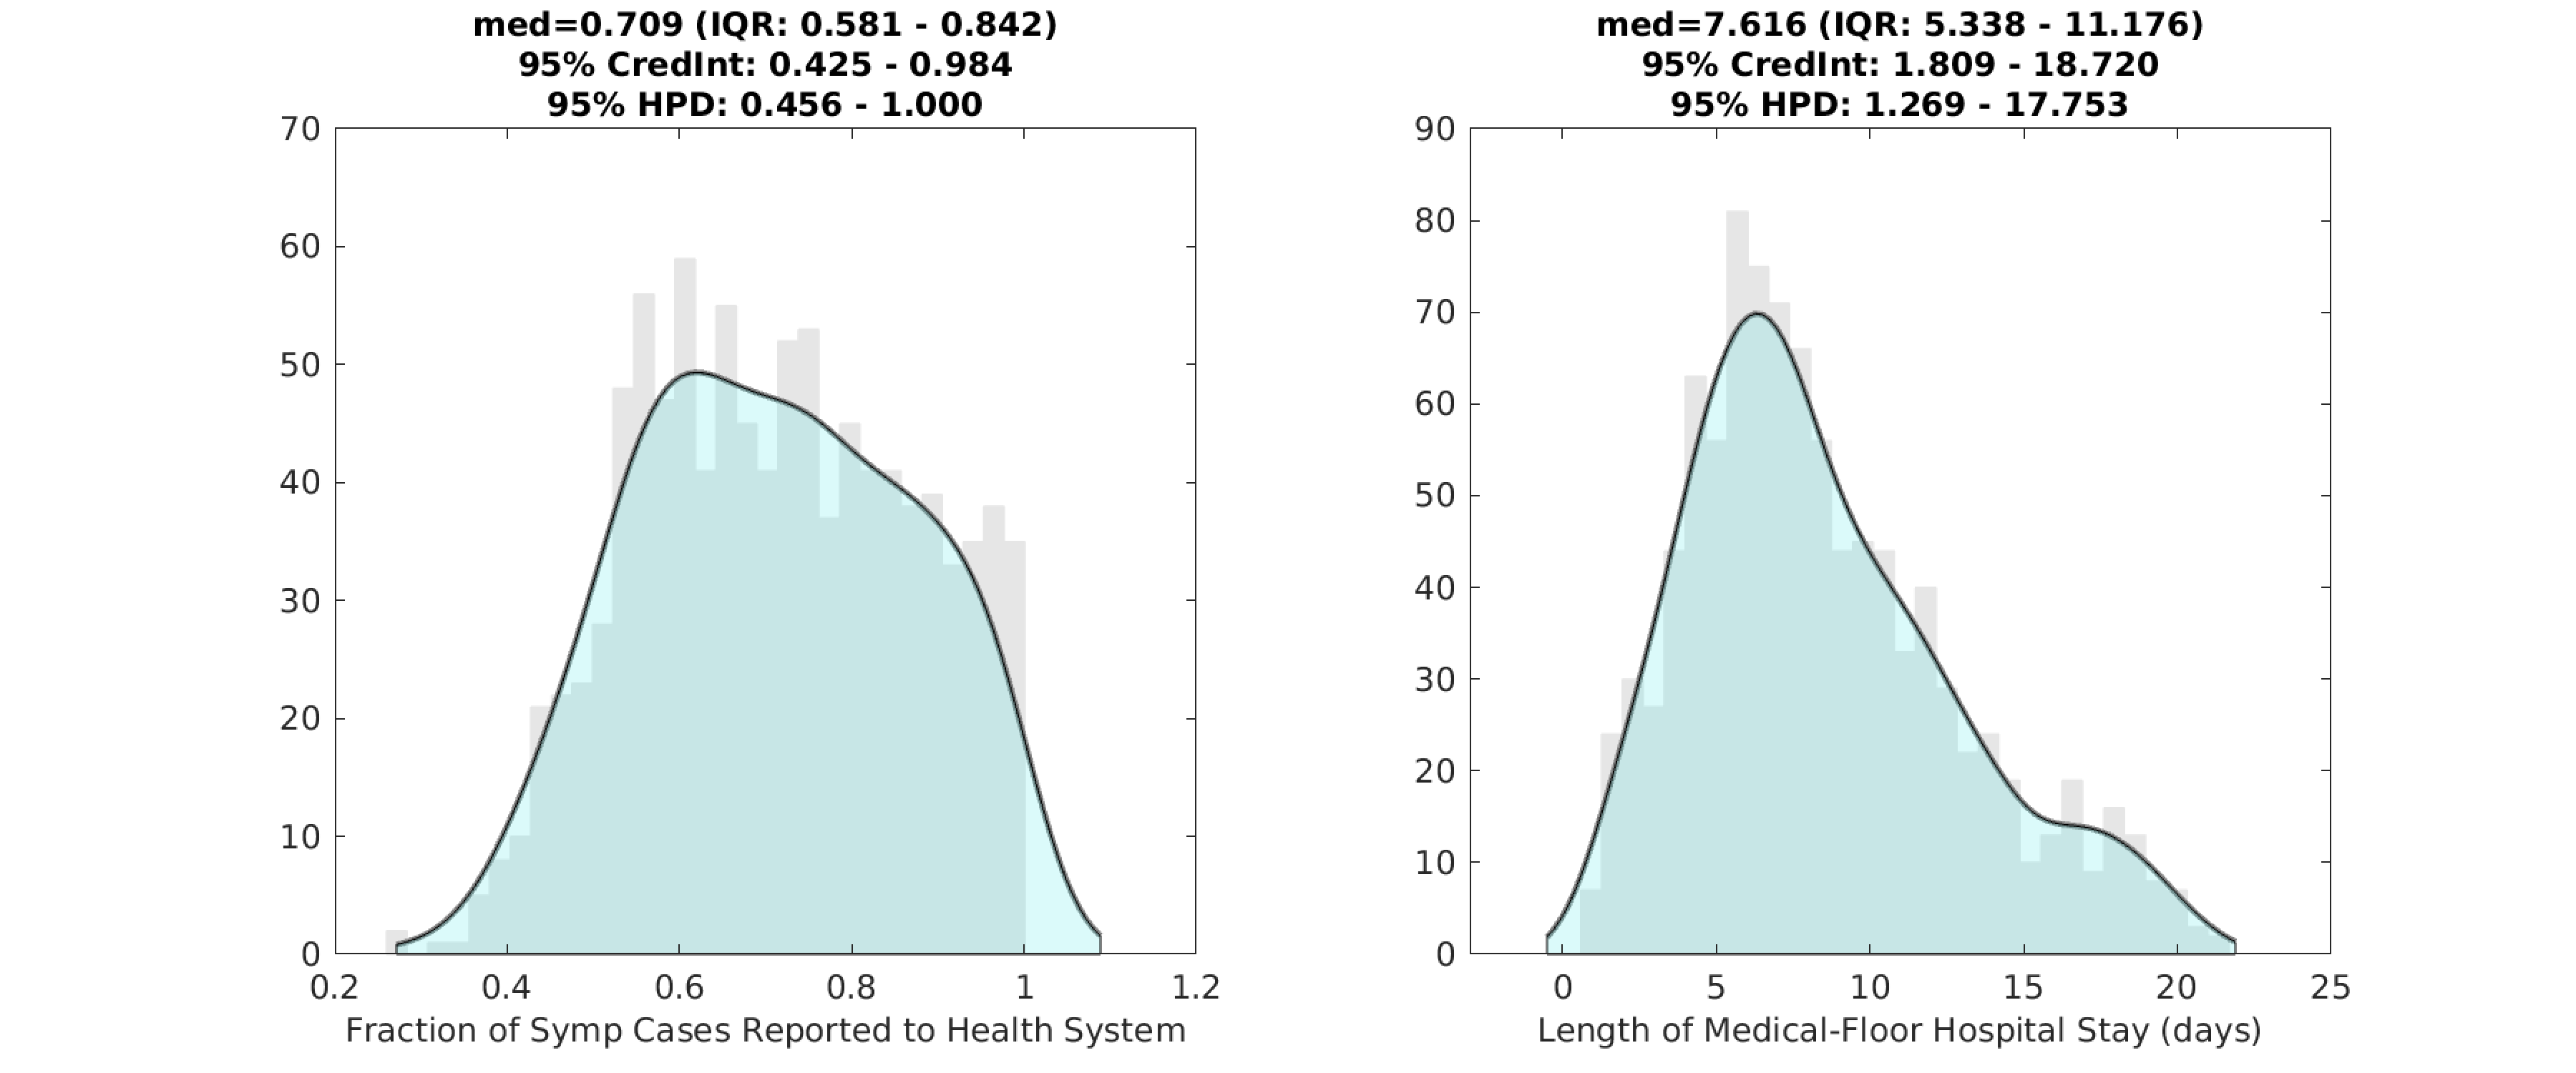
Figure 2. Posterior distributions for the reporting rate ρ (left) and the duration of hospital stay (right) for non-ICU patients. Gray bar graph in the background shows a histogram of 1000 samples from the posterior, and the filled green area is a kernel-smoothed density function. Medians, credible intervals, and HPD intervals are shown above each plot.
Probability (pH) of hospitalization for symptomatic patients was estimated, but not for all age-classes independently. Using early data on probabilities of hospitalization reported by the CDC, we estimated age-specific hospitalization probabilities constraining them in their relative proportions. Specifically, pH for individuals under 20 was assumed to be a single value that was fit; pH for individuals aged 20-60 was assumed to be in proportions roughly equal to 0.20, 0.20, 0.25, 0.30, by 10-year age band from youngest to oldest; pH for individuals >60 was assumed to be in proportions roughly equal to 0.37, 0.51, 0.64, for the age groups 60-69, 70-79, and 80+, respectively. These proportions were kept in place as we were not sure if we had enough hospitalization data to estimate pH for nine age bands. In Rhode Island, probability of hospitalization for individuals under 60 was between 2% and 4%. Hospitalization risk increased sharply for older individuals, with probability of hospitalization estimated at 12.4% (ages 60-69), 17.3% (ages 70-79), and 21.8% (ages 80 and up).
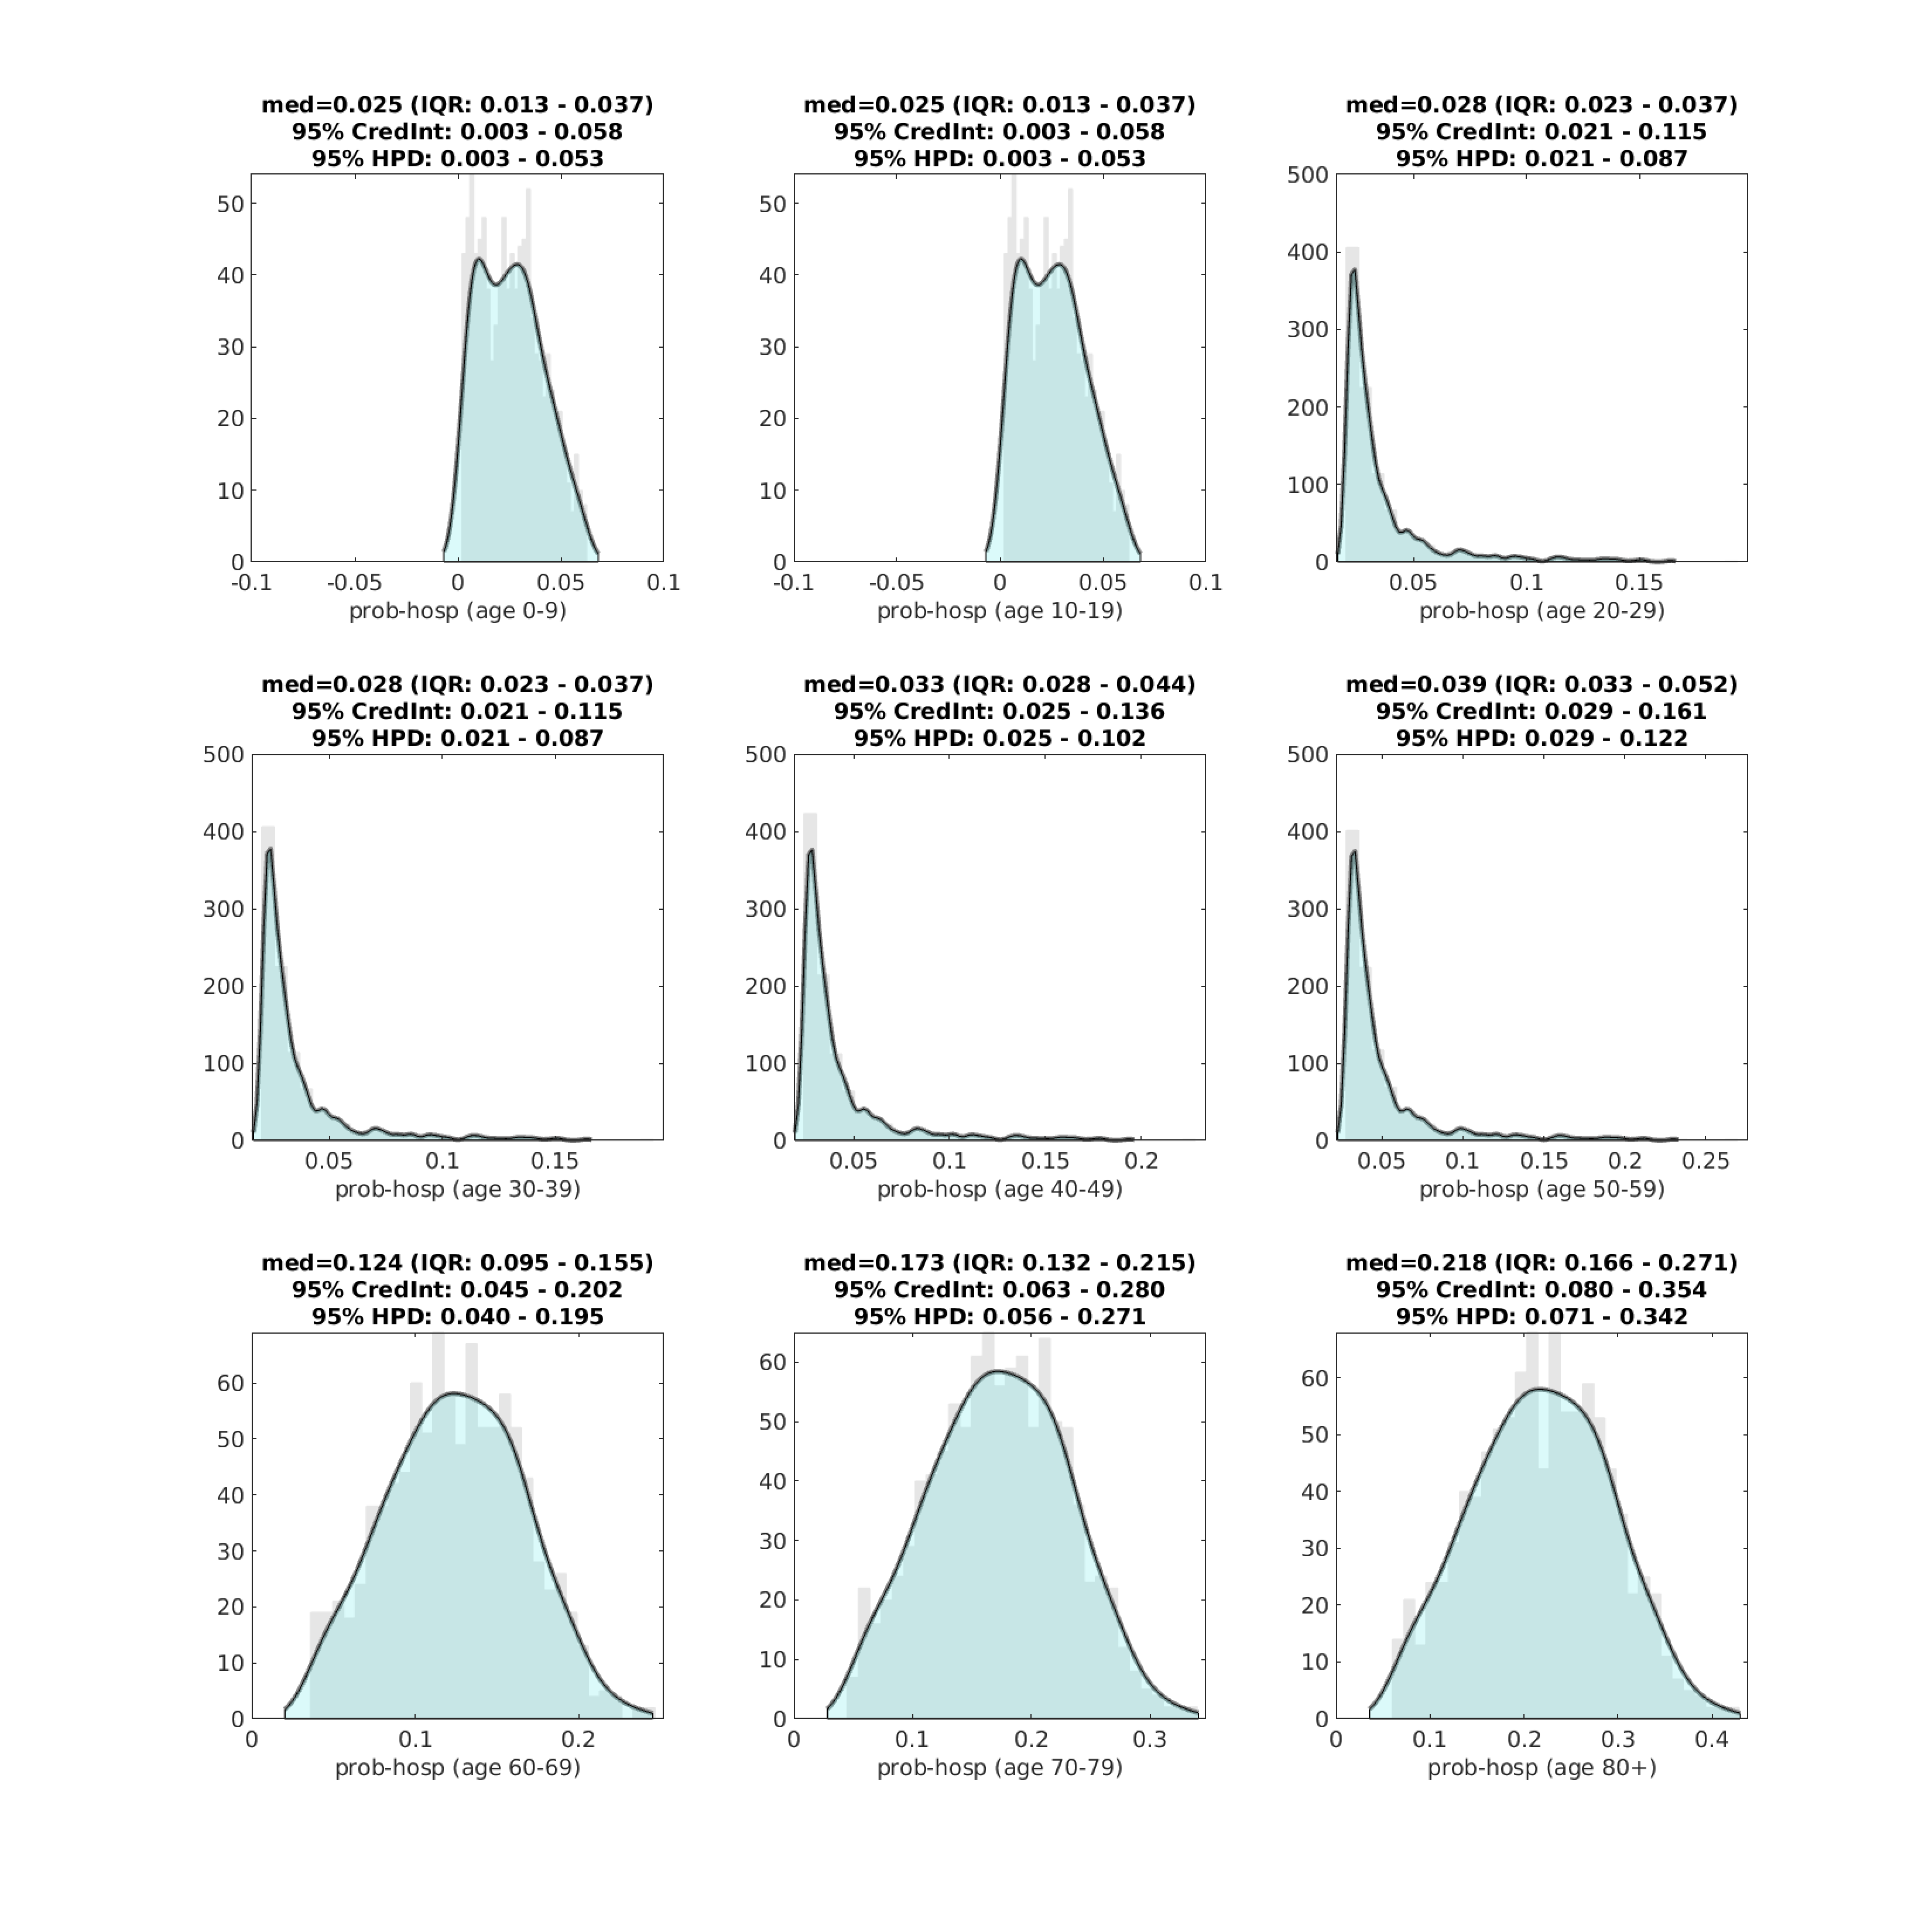
Figure 3. Posterior distributions for age-specific probability of hospitalization (pH). Gray bar graph in the background shows a histogram of 1000 samples from the posterior, and the filled green area is a kernel-smoothed density function. Medians, credible intervals, and HPD intervals are shown above each plot.
A single scaling value was estimated for the probability that a hospitalized patient progresses to the ICU. Relative probabilities by age class were taken from an analysis of 1277 hospitalized patients in California and Washington state; these probabilities ranged from 30% to 50% depending on age group. ICU admission rates, per hospitalized patient, were about two-thirds as high in Rhode Island as in the data from California and Washington. This lower rate of ICU admission could reflect differences in hospital admission criteria, algorithms for tranferring patients to the ICU, earlier admission leading to improved outcomes, or a number of other factors.
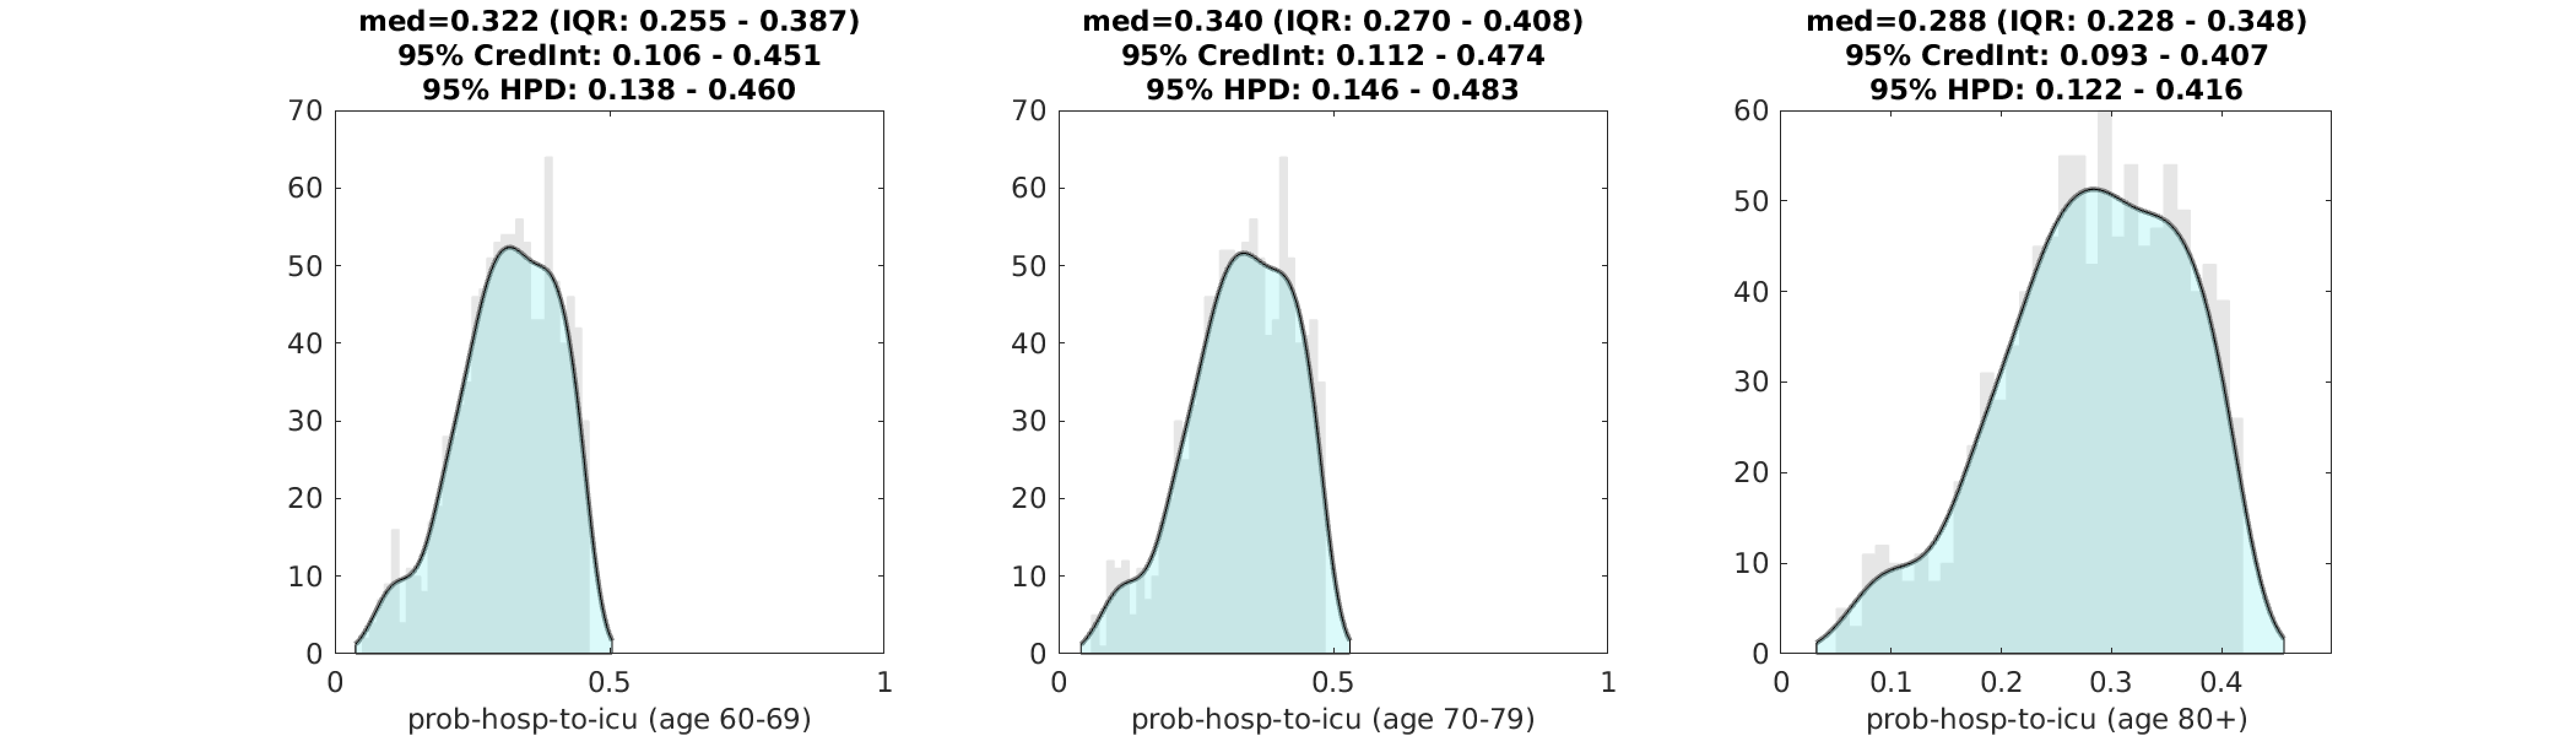
Figure 4. Posterior distributions for age-specific probability of ICU admission for a patient that is already hospitalized. Gray bar graph in the background shows a histogram of 1000 samples from the posterior, and the filled green area is a kernel-smoothed density function. Medians, credible intervals, and HPD intervals are shown above each plot. We only show this estimation for the >60 age classes, as the distribution is identical (with slightly lower values) for the younger age classes.
Scenario Evaluation
We evaluate three scenarios of mixing and transmission levels for the remainder of May. In the first scenario, we project case numbers and epidemic dynamics forward assuming that population mixing stays below 30% of the original level observed in early March. In other words, this is a scenario with strong social distancing measures still in place, to the same degree as was seen in mid-April. In the second scenario, we project case numbers forward assuming a partial relaxation of social distancing measures that return social contacts to between 30% and 70% of their original level. In the third scenario, we evaluate a scenario in which social distancing returns to its original early March level with no social distancing or physical distancing measures in place; under this scenario mixing levels are >70% of normal levels, as some individuals will continue to distance by choice and higher hygiene standards are likely to be maintained.
When social mixing stays <30% of original levels (i.e. at the mid-April level), the epidemic appears to be controllable. Median case numbers decline from their April 23 peak of 437 new cases and decline to about 200 cases per day by the second half of May, which is in agreement with current trends in the data.
When social mixing is relaxed to 30%-70% of normal levels (i.e. at late-March levels), the epidemic rebounds and case numbers increase. Because the vast majority of the population in Rhode Island is still susceptible, an R-value larger than one results in a sustained increase in case numbers through most of May. Judging by the shape of these curves the virus’s effective reproductive number (R-value) is not “just barely above one”, but high enough to cause a nearly full-sized epidemic to occur during this rebound. This is the scenario that would have occured if a May 1 re-opening had caused mixing rates to about double from mid/late-April levels. Note that our model assumes equal mixing (mean field) for the entire population. We would forecast smaller case numbers if we accounted for geographic structure and variation in susceptibility in the population.
If social distancing restrictions are removed (mixing at >70% of normal levels), the epidemic proceeds on its unmitigated course infecting >80% of the population, causing thousands of hospitalizations, and over one thousand deaths.
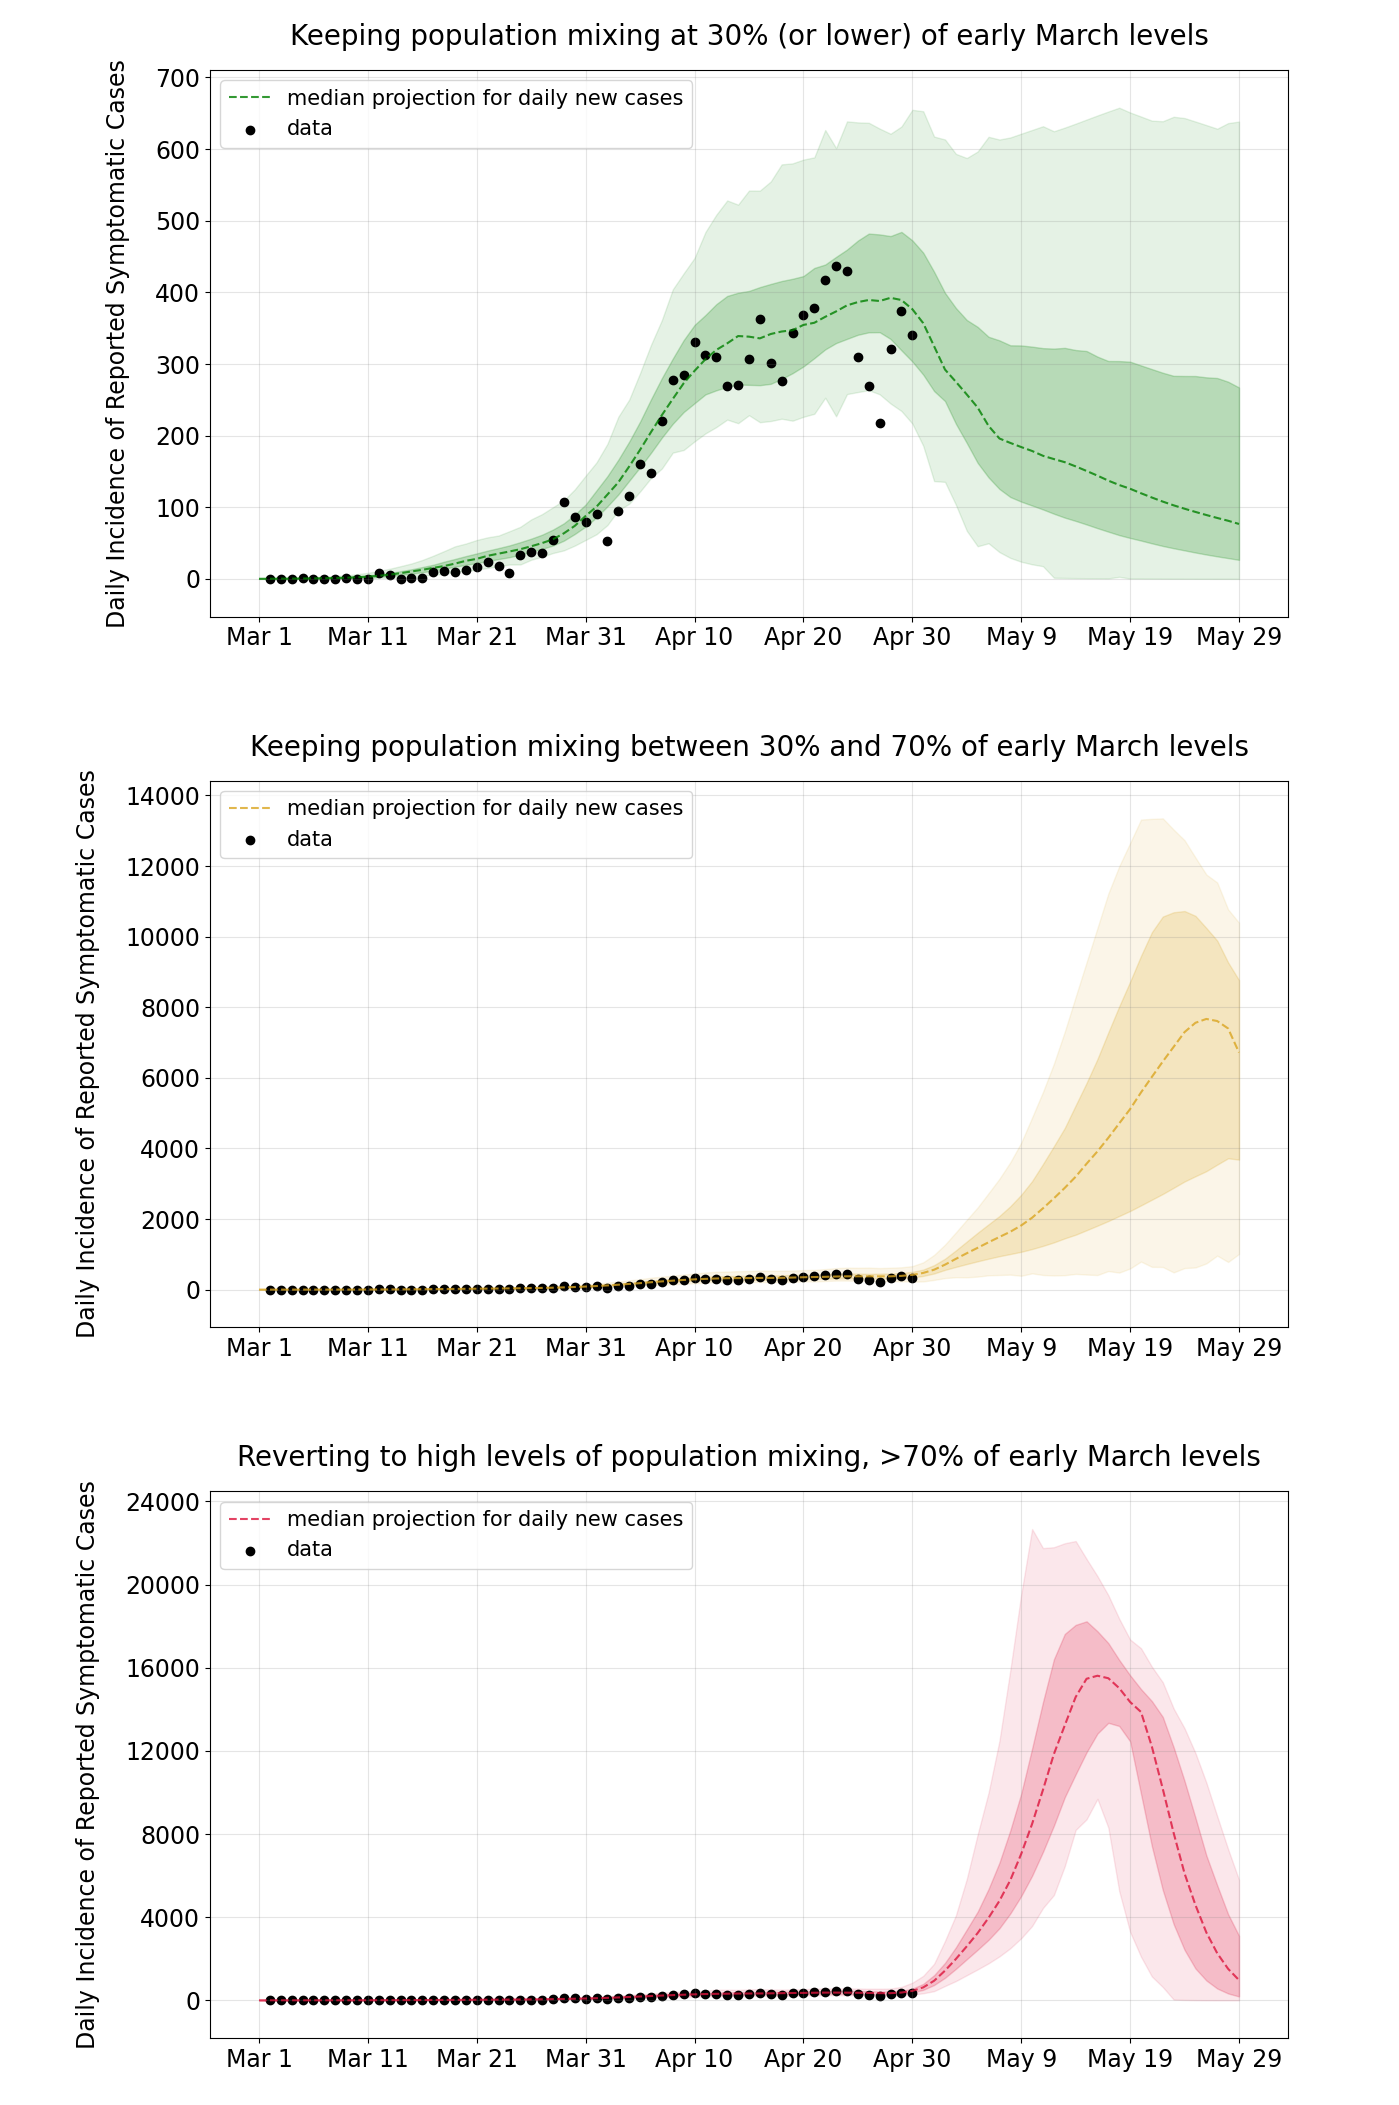
Figure 5. Projections for daily reported case numbers under three scenarios. In the top scenario, social mixing stays at low levels, <30% of normal or typical mixing levels. In the middle scenario, distancing measures are relaxed and mixing stays at 30% to 70% of normal levels. In the bottom scenario, mixing returns to >70% of normal levels. Black dots are data points. The bands show the interquartile range and the 95% range.
Conclusions and Limitations
With 11,835 confirmed cases reported by May 13, a reporting rate of ρ=0.71, and an assumption that about two-thirds of cases are asymptomatic (this is the ODE model’s assumption currently), we approximate a total number of 50,082 infections having occurred by May 13 (4.7% of the population). If the asymptomatic fraction is as low as 0.50 or as high as 0.75, the total number of cases would vary from 33,385 to 66,770 (3.2% to 6.3% of the population).
This would imply that the underreporting factor in Rhode Island is somewhere between 2.8 and 5.6, which is on the lower end of those observed in other localities both within and outside the US.
In order to perform a more complete statistical analysis on the age-specific probabilities of hospitalization and ICU admission, more detailed age-structured data will be needed. We will attempt age-specific inference for all age-classes in a subsequent analysis.
The mathematical transmission model assumes that all individuals in Rhode Island have an equal chance of getting infected by any other Rhode Islander. This is called a mean field model and is an oversimplification of the true network structure of the population. Individuals also have different levels of exposure by age, city, neighborhood, occupation, socio-economic status, and many other factors. Geographic structure and variation in susceptibility have the effect of reducing rate of spread in the population; based on this, the forecast case numbers in Figure 5 are likely to be overestimates.
The current symptomatic case fatality rate (sCFR) in Rhode Island appears to be a minimum of 2.6% (as this does not account for the needed correction for the delay from case presentation to death). With an underreporting factor between 2.8 and 5.6, this would imply an infection fatality ratio (IFR) between 0.47% and 0.93%, which is within the expected IFR range measured in other states and countries.
Updates and Corrections
May 23 2020 — this analysis contains a scaling error in the β-estimation in Figure 1. Although, the general estimated reduction in social mixing levels is qualitatively correct, the sizes of the mixing reductions are under-estimated here. Our updated analysis. contains the correctly scaled β-estimates.