May 23 2020
Data Update, Bug Fix
Update
Figures below show an updated analysis with more recent data as well as a bug fix in our β calculation. Data included through May 16 2020.
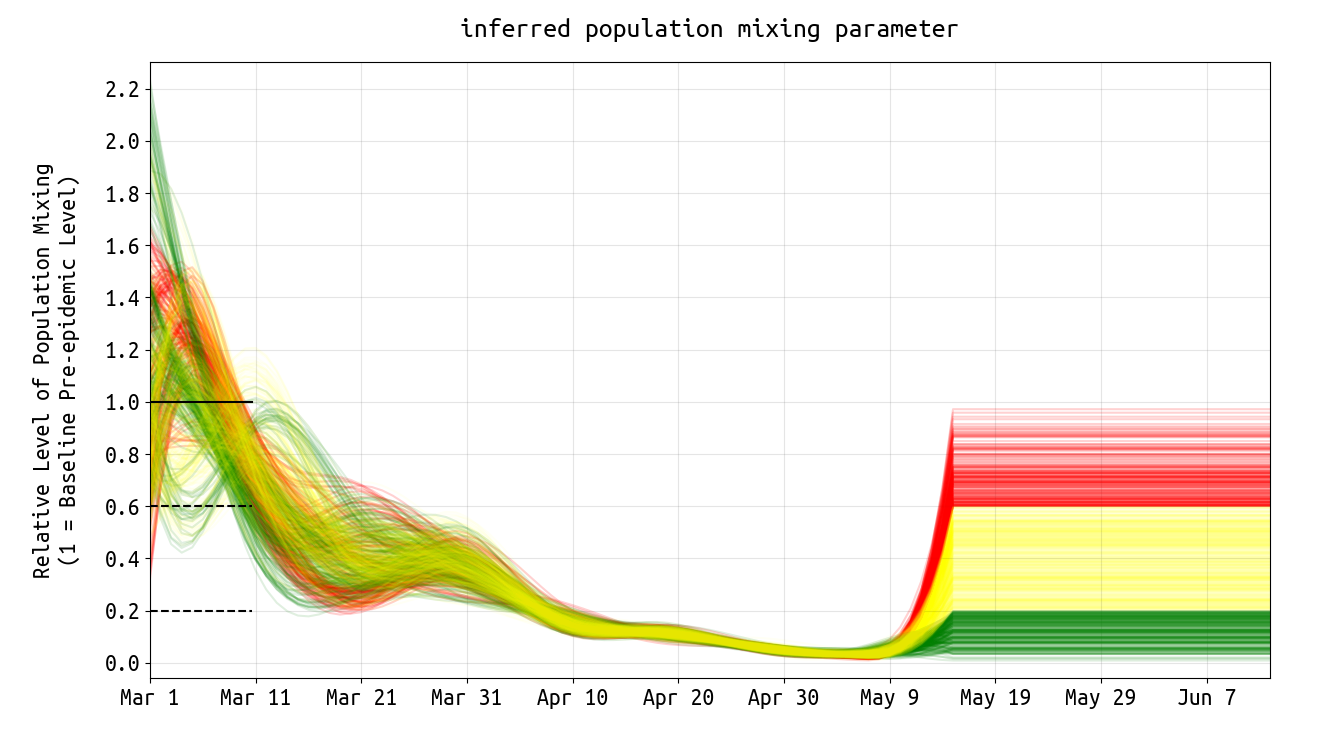
Figure 1. Plots of posterior daily β-parameters that represent mixing and social/physical contact in the population. The horizontal black line shows the mean mixing level (β-value) for the first ten days of March and is normalized at 1.0. The two horizontal dashed lines correspond to reduced levels of mixing, at 40% below and 80% below early-March levels. Population mixing levels dropped 60% by late March, and more than 80% by mid-April. Data for inference included case data through May 16, hence there is uncertainty in the mixing rate from May 9 to May 16. The horizontal lines above (after May 16) show the assumed mixing rates in the simulations in Figure 5 below, where the green lines correspond to rates that are 80% or lower than the early March values. The yellow lines correspond to mixing rates that are 40% to 80% lower than early-March levels. The red lines show mixing rate that are close to early-March values (0% to 40% lower).
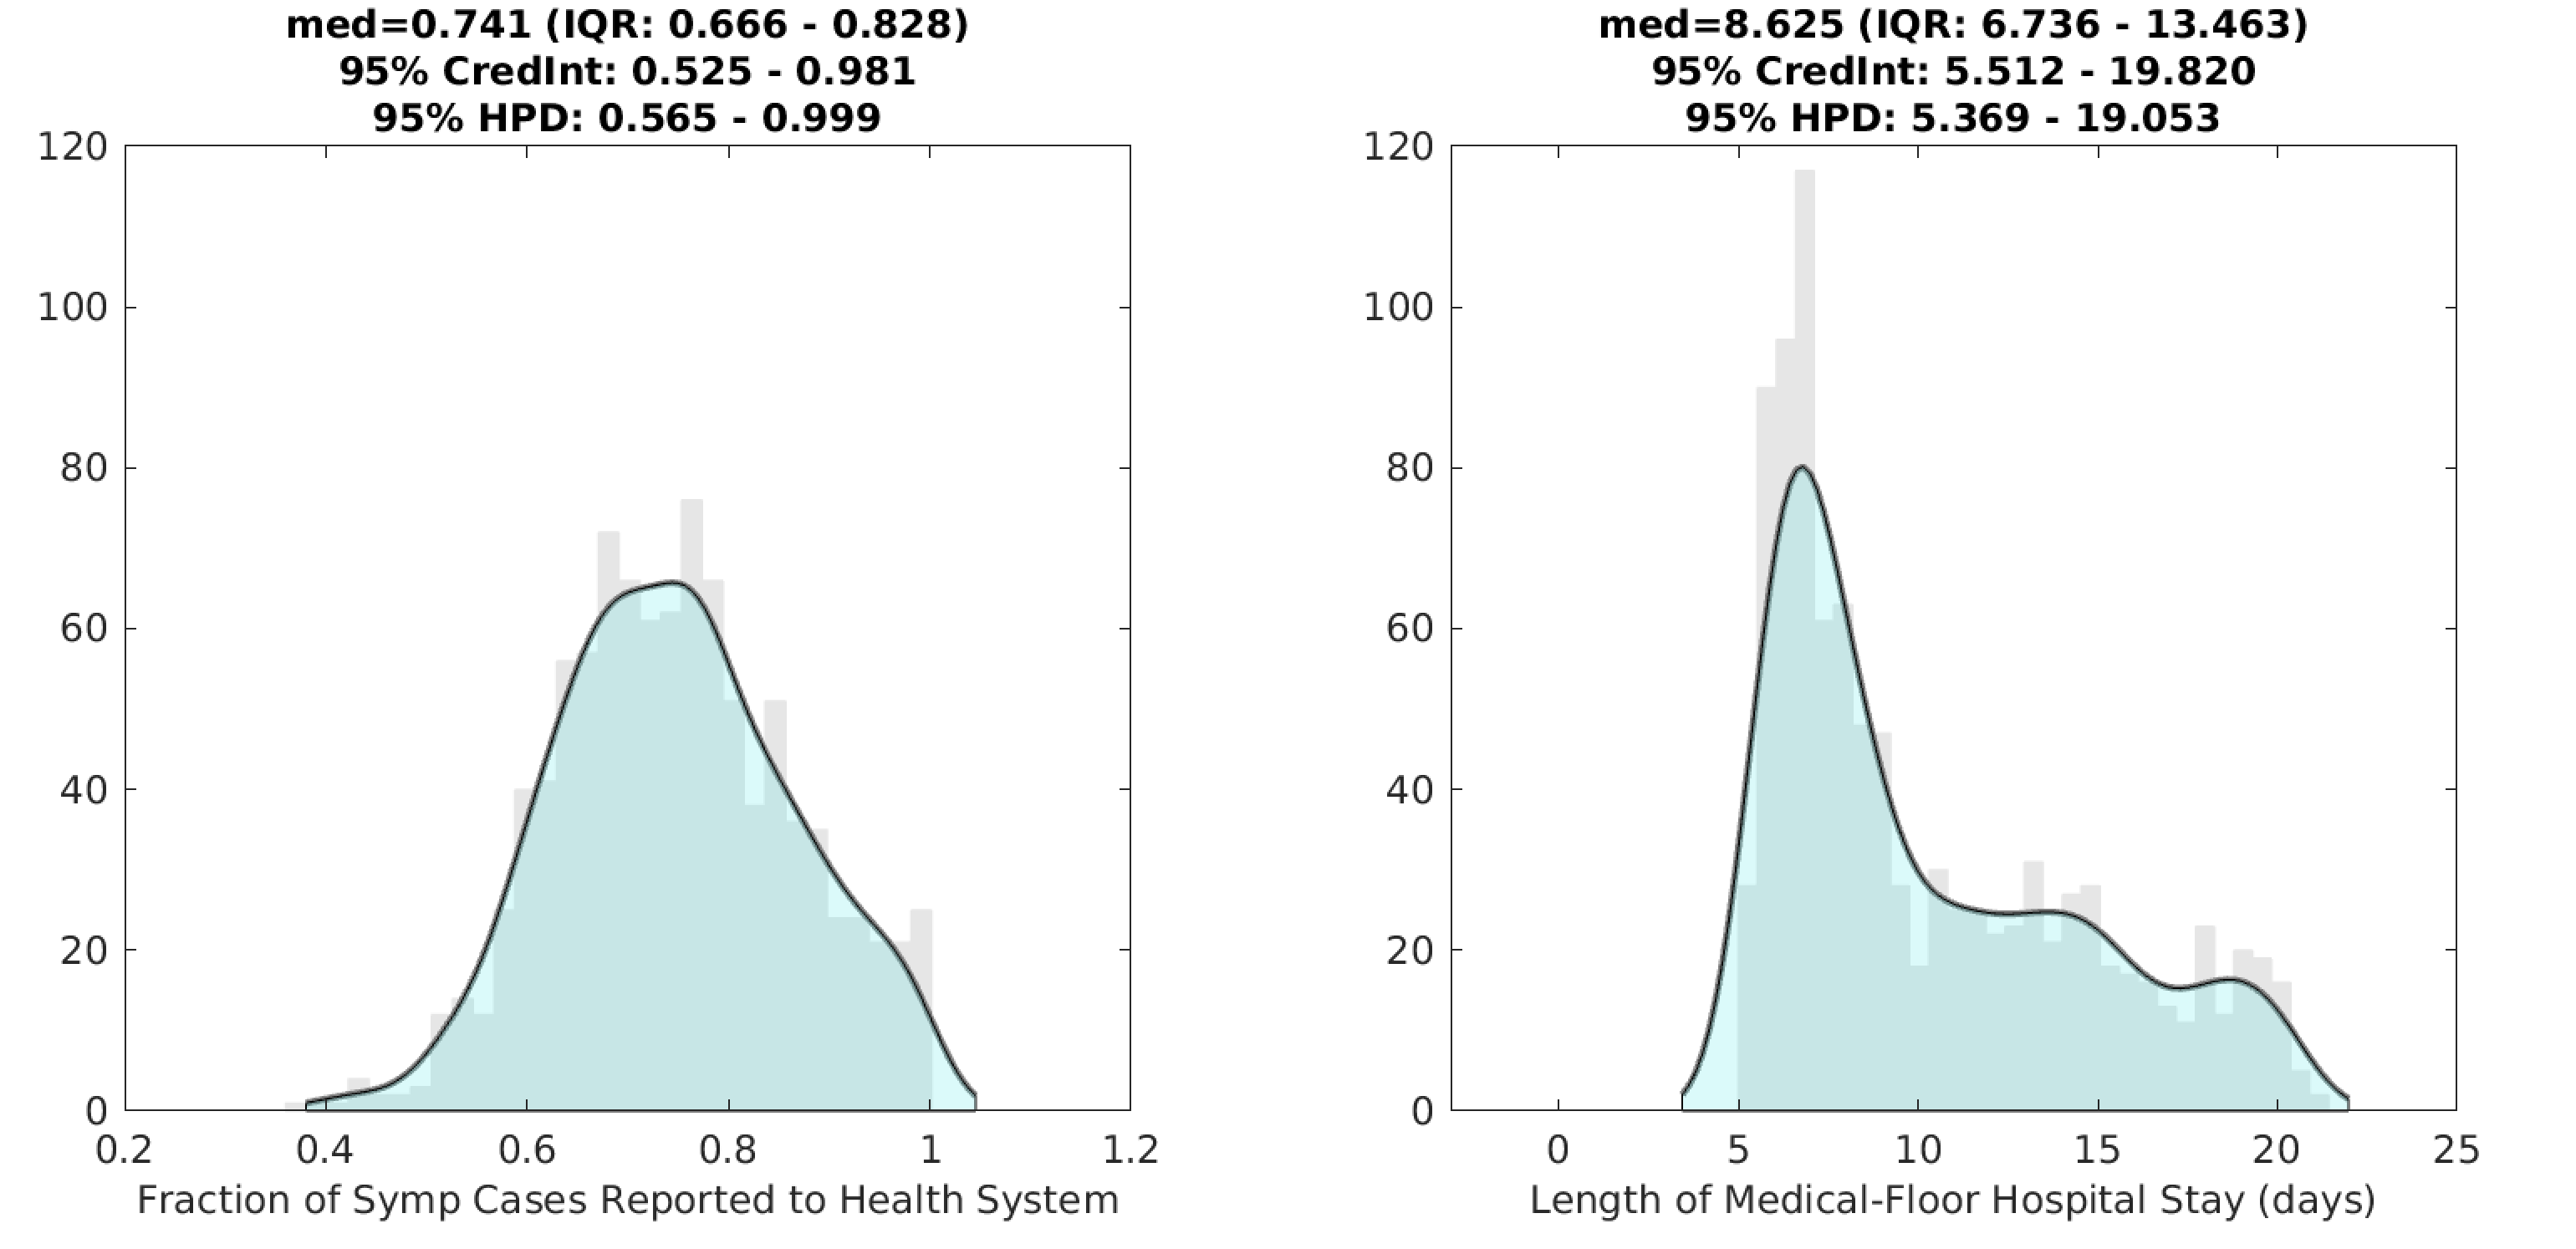
Figure 2. Posterior distributions for the reporting rate ρ (left) and the duration of hospital stay (right) for non-ICU patients. Gray bar graph in the background shows a histogram of 1000 samples from the posterior, and the filled green area is a kernel-smoothed density function. Medians, credible intervals, and HPD intervals are shown above each plot.
Reminder: probability (pH) of hospitalization for symptomatic patients was estimated, but not for all age-classes independently. Specifically, pH for individuals under 20 was assumed to be a single value that was fit. For individuals aged 20-60, pH was assumed to be in proportions roughly equal to 0.20, 0.20, 0.25, 0.30, by 10-year age band from youngest to oldest; pH for individuals >60 was assumed to be in proportions roughly equal to 0.37, 0.51, 0.64, for the age groups 60-69, 70-79, and 80+, respectively. In Rhode Island, probability of hospitalization for individuals under 60 was between 2% and 4%. Hospitalization risk increased sharply for older individuals, with probability of hospitalization estimated at 11.2% (ages 60-69), 15.6% (ages 70-79), and 19.6% (ages 80 and up).
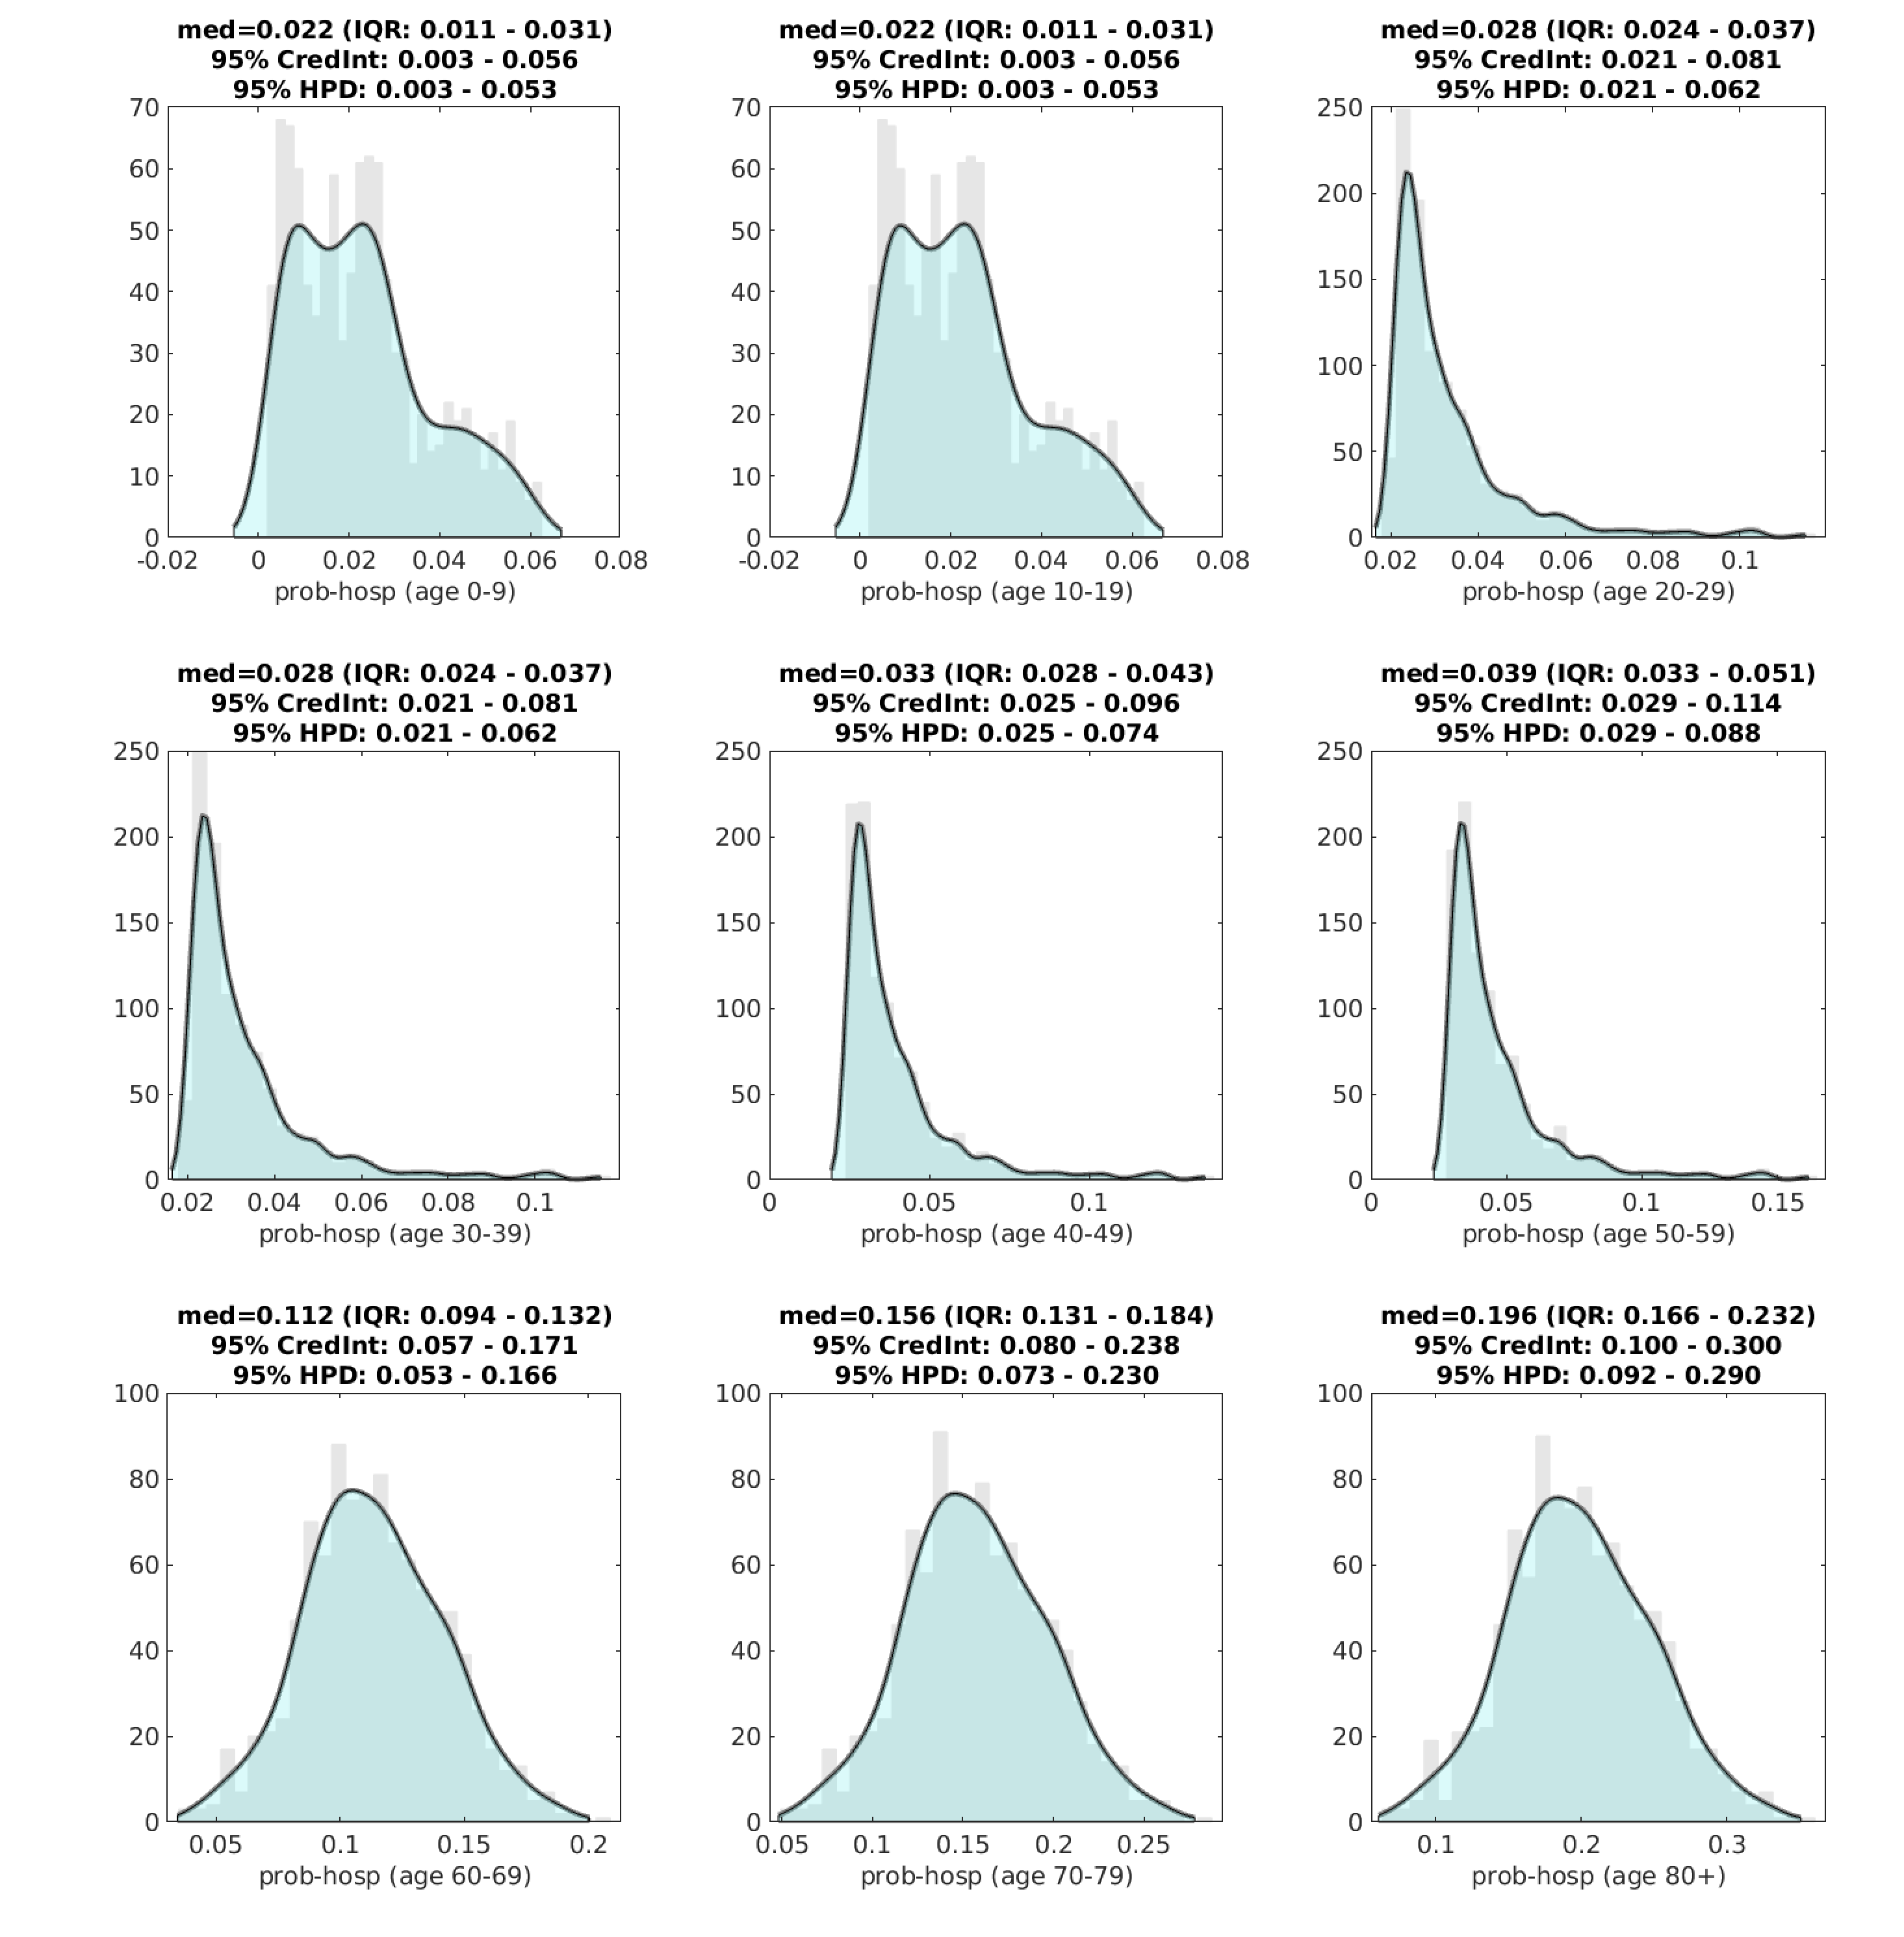
Figure 3. Posterior distributions for age-specific probability of hospitalization (pH) for symptomatic individuals. Gray bar graph in the background shows a histogram of 1000 samples from the posterior, and the filled green area is a kernel-smoothed density function. Medians, credible intervals, and HPD intervals are shown above each plot.
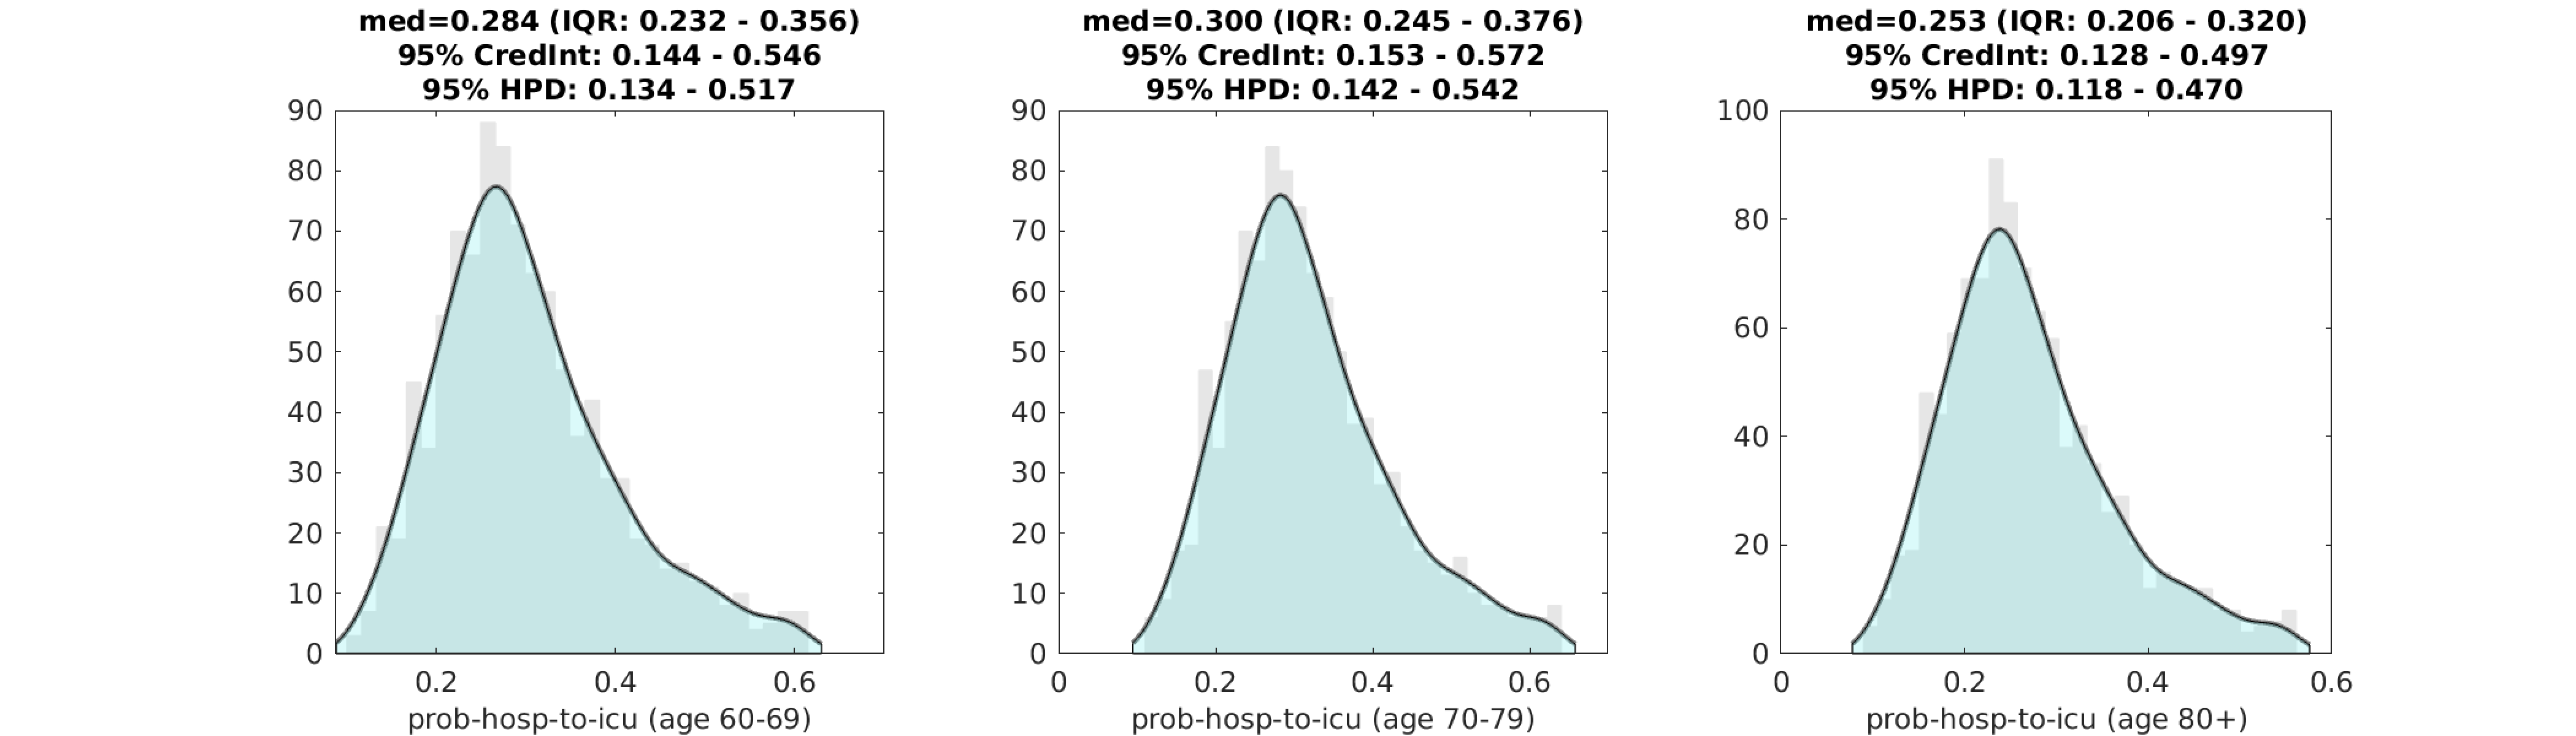
Figure 4. Posterior distributions for age-specific probability of ICU admission for a patient that is already hospitalized. Gray bar graph in the background shows a histogram of 1000 samples from the posterior, and the filled green area is a kernel-smoothed density function. Medians, credible intervals, and HPD intervals are shown above each plot. We only show this estimation for the >60 age classes, as the distribution is identical (with somewhat lower values) for the younger age classes.
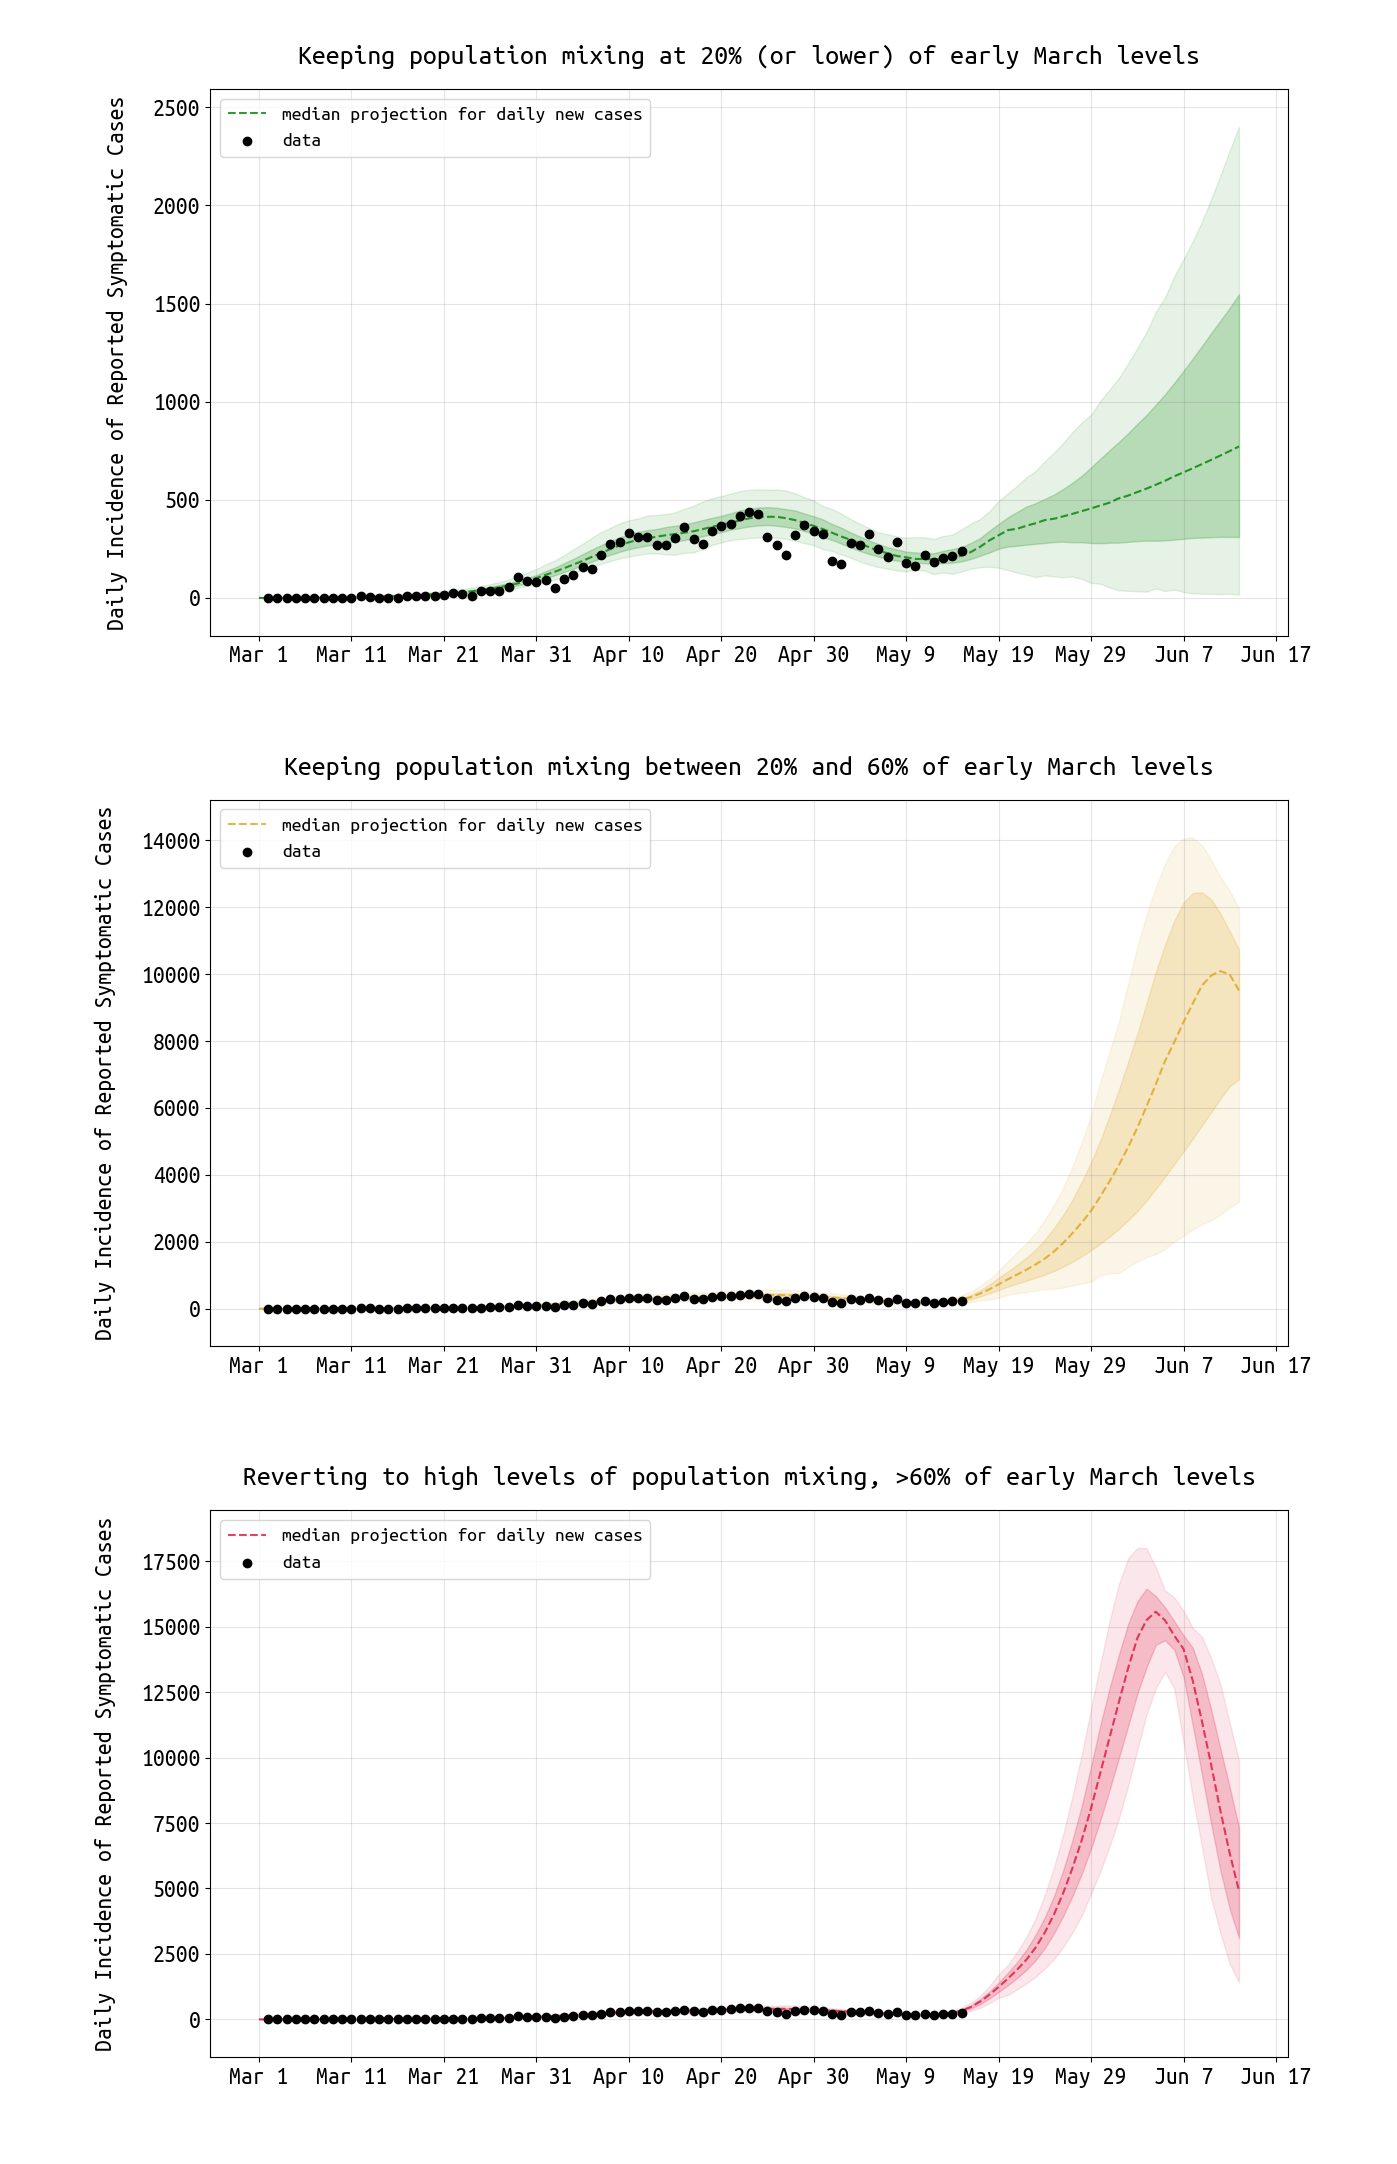
Figure 5. Projections for daily reported case numbers under three scenarios. In the top scenario, social mixing stays at low levels, <20% of normal or typical mixing levels. In the middle scenario, distancing measures are relaxed and mixing stays at 20% to 60% of normal levels. In the bottom scenario, mixing returns to >60% of normal levels. Black dots are data points. The bands show the interquartile range and the 95% HPD ranges. The red curve shows an unmitigated epidemic. The yellow curve shows an outcome with insufficient social/physical distancing.
Conclusions and Limitations
With 13,736 confirmed cases reported by May 22, a reporting rate of ρ=0.74, and an assumption that about two-thirds of infections are asymptomatic (this is the ODE model’s assumption currently), we approximate a total number of 55,611 infections having occurred by May 22 (5.3% of the population). If the asymptomatic fraction is as low as 0.50 or as high as 0.75, the total number of infections would vary from 37,074 to 74,148 (3.5% to 7.0% of the population).
As case numbers appear to be focused in the middle age groups, we will report age-specific attack rates in our next analysis.
With re-opening currently the most important area of evaluation, our simulations suggest that returning to higher levels of contact will bring higher case numbers (Figure 5). Thus, it is critical that all re-opened sectors have accompanying hygiene guidelines and physicial distancing rules (as much as is possible) to limit the role of any increased transmission.
As recent data in Rhode Island have shown higher than expected case numbers in Hispanic/Latinx populations, and higher than expected fatalities occurring outside hospitals, our next analysis will attempt to capture some of these features of the epidemic.
Updates and Corrections
No updates or corrections at this time.