April 27 2020
Preliminary Analysis
Summary
For Rhode Island, we used an epidemiological model of SARS-CoV-2 transmission to fit the first case reporting data through April 24 2020, in order to infer changes in the population mixing parameter from early March to late April. From early March to late March, the degree of physical contact and social mixing in Rhode Island appears to have dropped by more than 80%. These reductions appear to have been maintained through April. The forecasted number of new symptomatic COVID cases reporting to the health system on May 15 is 1260 (Interquartile Range: 1071–1678).
Background
Rhode Island’s first confirmed case of SARS-CoV-2 occurred on Feb 29 2020. There were multiple suspected cases tested during this early phase of the epidemic when Rhode Islanders were returning from overseas trips from Europe, including Italy. On March 11, the state issued guidance that events where >250 persons would be concentrated in the same place (parades, sporting events) should be cancelled. Events with larger numbers of older adults were discouraged, and symptomatic individuals were discouraged from attending any events at all. On March 13, schools were closed for a week for disinfection, international travelers were urged to self-quarantine, all Rhode Islanders were asked to avoid large events, and nursing homes were directed to stop non-essential visits. On March 16, restaurants, bars, and other food establishements were directed to shift to take-out and delivery only (no on-premise food consumption), and gatherings of >25 persons were banned. On March 18, a school closure began that is still in effect today.
PCR confirmations of COVID positive patients reached five individuals on March 10, 66 cases by March 20, and 488 cases by March 30. As of April 24 2020, 7129 cases were confirmed including 222 deaths.
Methods
Details are listed on our Methods Page. Briefly, we assembled data from CovidTracking.com and the Rhode Island Department of Health COVID Data Hub, checked for consistency, and used RIDOH data if there were any discrepancies. In the analysis presented on this page, only new symptomatic case data were used; the age-structure of these cases was not used and hospitalization data were not included.
A mathematical transmission model with an SEIR-like structure and daily variation in the social mixing and contact parameter (β) was used to fit the daily incidence data. The model parameterization assumes that the average incubation period is 6.0 days (coefficient of variaion = 0.41) and that the mean infectious period is 14.0 days (CV=0.5).
Daily β-values were modeled using cubic-spline basis functions with interior knots spaced seven days apart. A total of eight spline parameters were used to fit 54 days of case data. This structure allowed for substantial flexibility in the fitting of the β-values during a period when the population’s mixing behavior was shifting unpredictably and perhaps not smoothly; this flexibility also resulted in over-fitting. A Poisson observation function with a reporting rate ρ=0.25 was used to model the observation probability of daily case counts, using the mean incidence predicted by the ODE model. A reporting rate of ρ=0.25 was chosen as underreporting of symptomatic cases in the US has been esimated [version dated 24-04-2020] to be around a factor of eight; as Rhode Island’s testing capacity seems to be higher and epidemic response seems to be quicker than the US average, we adjusted the underreporting factor down to four.
Testing delays were accounted for in the likelihood function. March 9-13, mean test-to-result delay was 3 days. March 14-23, testing was done both in-house (same day results) and at RIDOH labs (3-7 day delay). March 24-27, 1-5 day delay. Testing was done selectively during this time, especially if an alternate diagnosis was more probable. After March 28, testing was performed for anyone with symptoms. Testing results came back same-day for inpatients and with a 1-5 day delay for outpatients. Outpatients made up >50% of presentations in late March.
An adaptive Markov Chain Monte Carlo approach in R was used for parameter estimation. 50,000 iterations were run. Chains were observed to converge visually, and 30,000 iterations of burn-in were removed.
Results
Posterior distributions for daily β-parameters were rescaled by the mean β-value between March 1 and March 10, representing the first ten days of the known epidemic in Rhode Island, but before any social distancting recommendations/requirements were put into place. Figure 1 shows the posterior distribution of all 54 relative mixing parameters from March 1 to April 23. By March 21, population-level mixing and contact patterns had dropped by more than 80% from their early March levels. This 80%-reduced level of contact appears to have been sustained through April. An analysis by the London School of Hygiene and Tropical Medicine shows a 50% contact level reduction in Rhode Island from March 9 to late April; our estimate for this time period is around 70%.
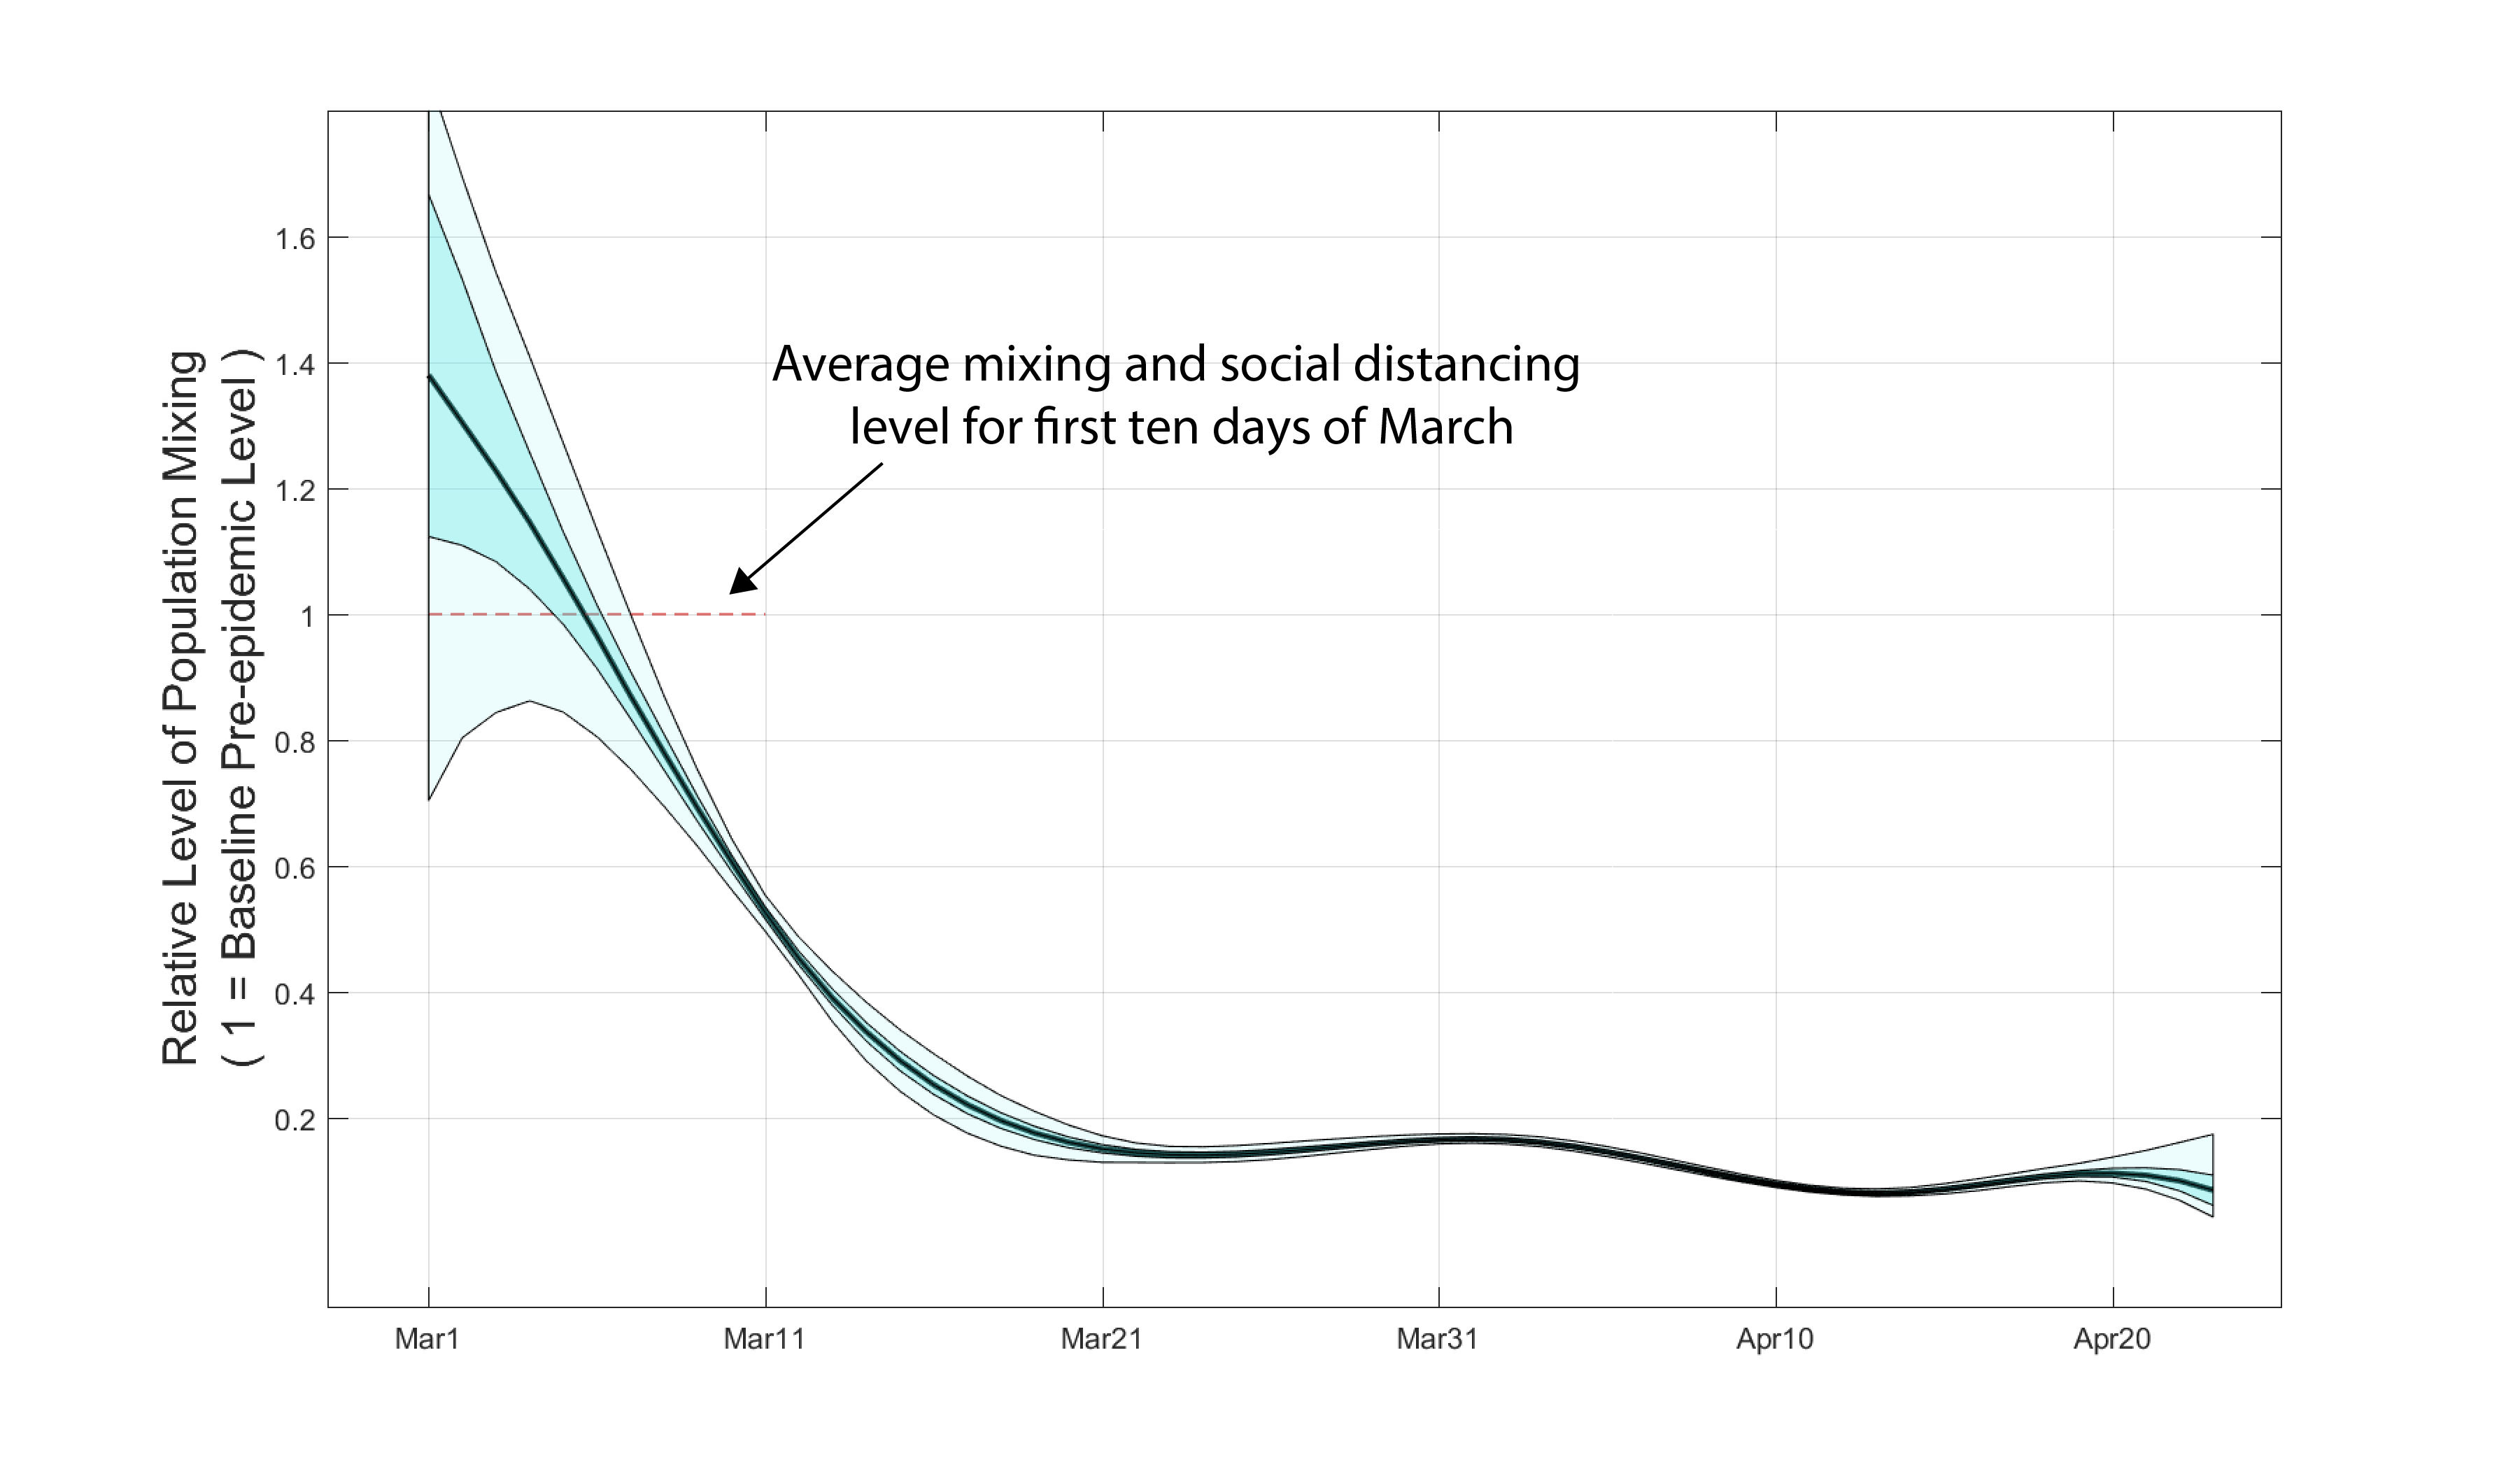
Figure 1. Posterior distribution for daily β-parameters that represent mixing and social/physical contact in the population. The black line is the posterior median relative β-value. The darker shaded region shows the posteriors’ interquartile range and the lighter shaded region shows the 95% credible interval.
Note that the β-values appear to be overfit after the first week of March. This occurs because the daily case data can be uniquely and optimally fit by a sequence of daily β-values. Nevertheless, the inferred βs show that the contact rate was relatively stable through time in late March and April; in other words, the overfitting did not result in sudden changes and reversals in the contact parameters. In later analyses, data on hospitalization status and age structure will likley show that there is larger uncertainty around the β-values inferred for March and April.
Using the posterior distribution for the daily β-values, a posterior distribution for the mean epidemic curve can be drawn (see Figure 2). Note that this is a posterior on the mean epidemic process and does not account for variation due to observation error or testing delays.
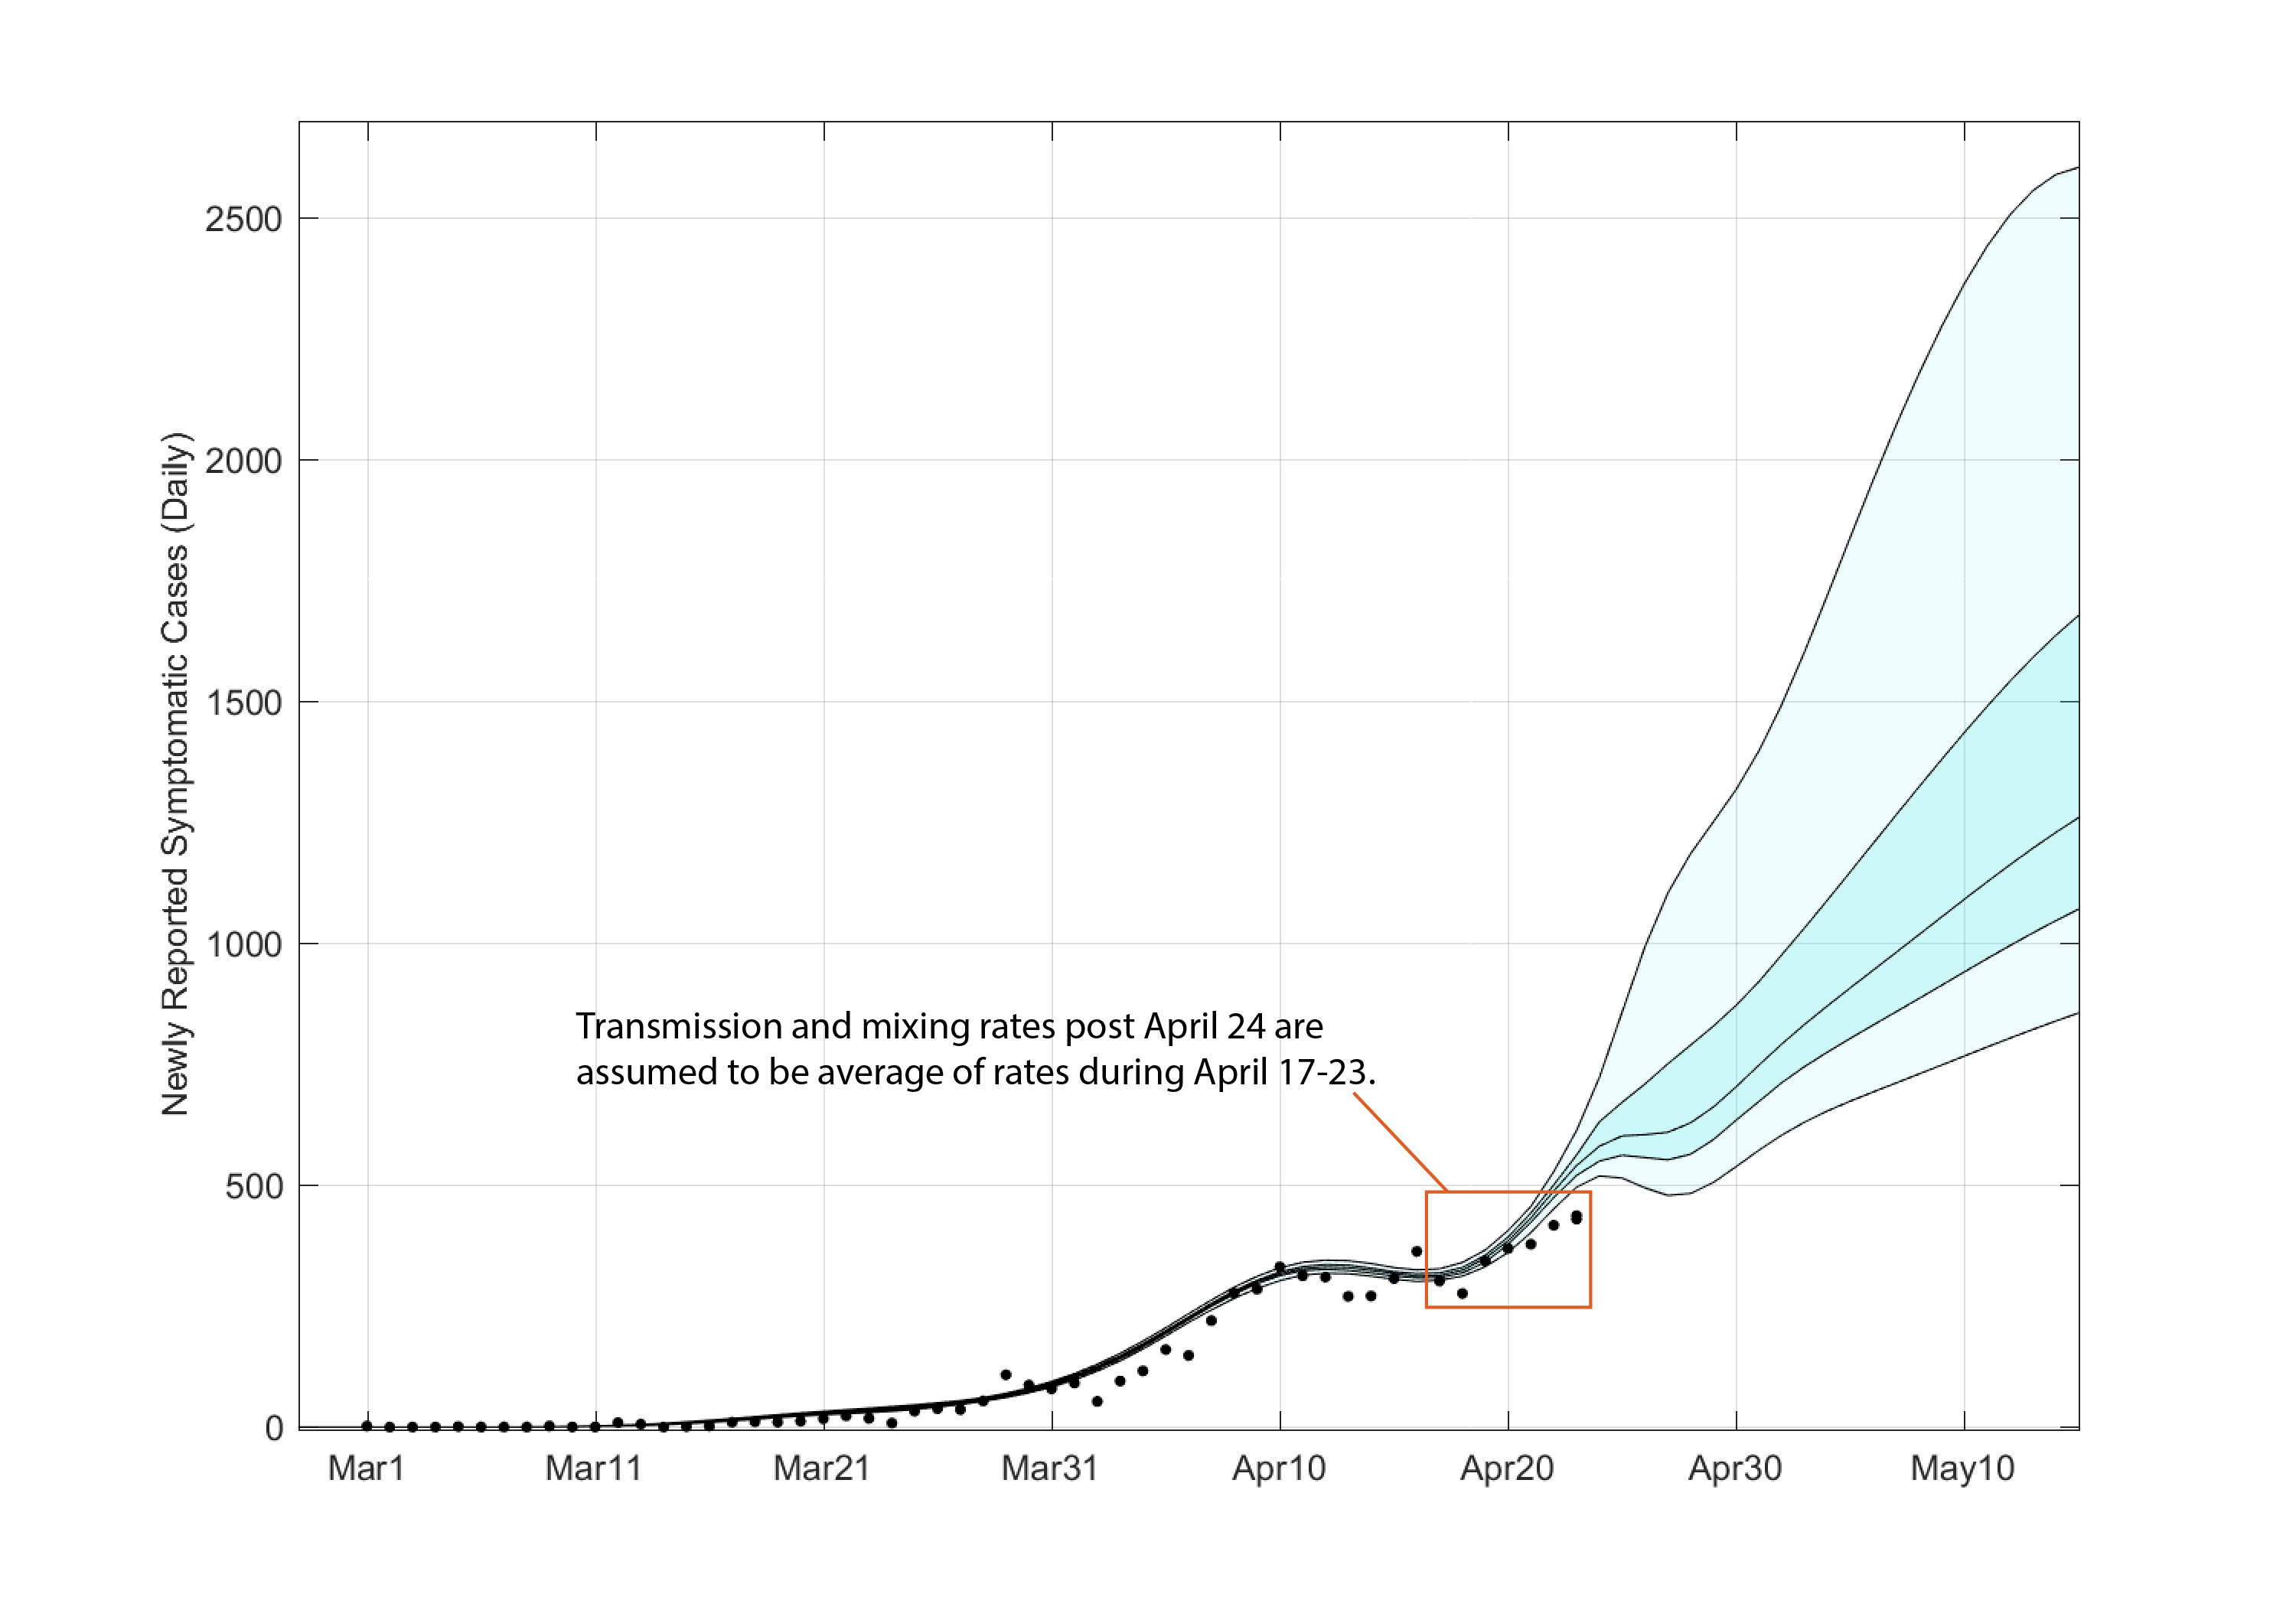
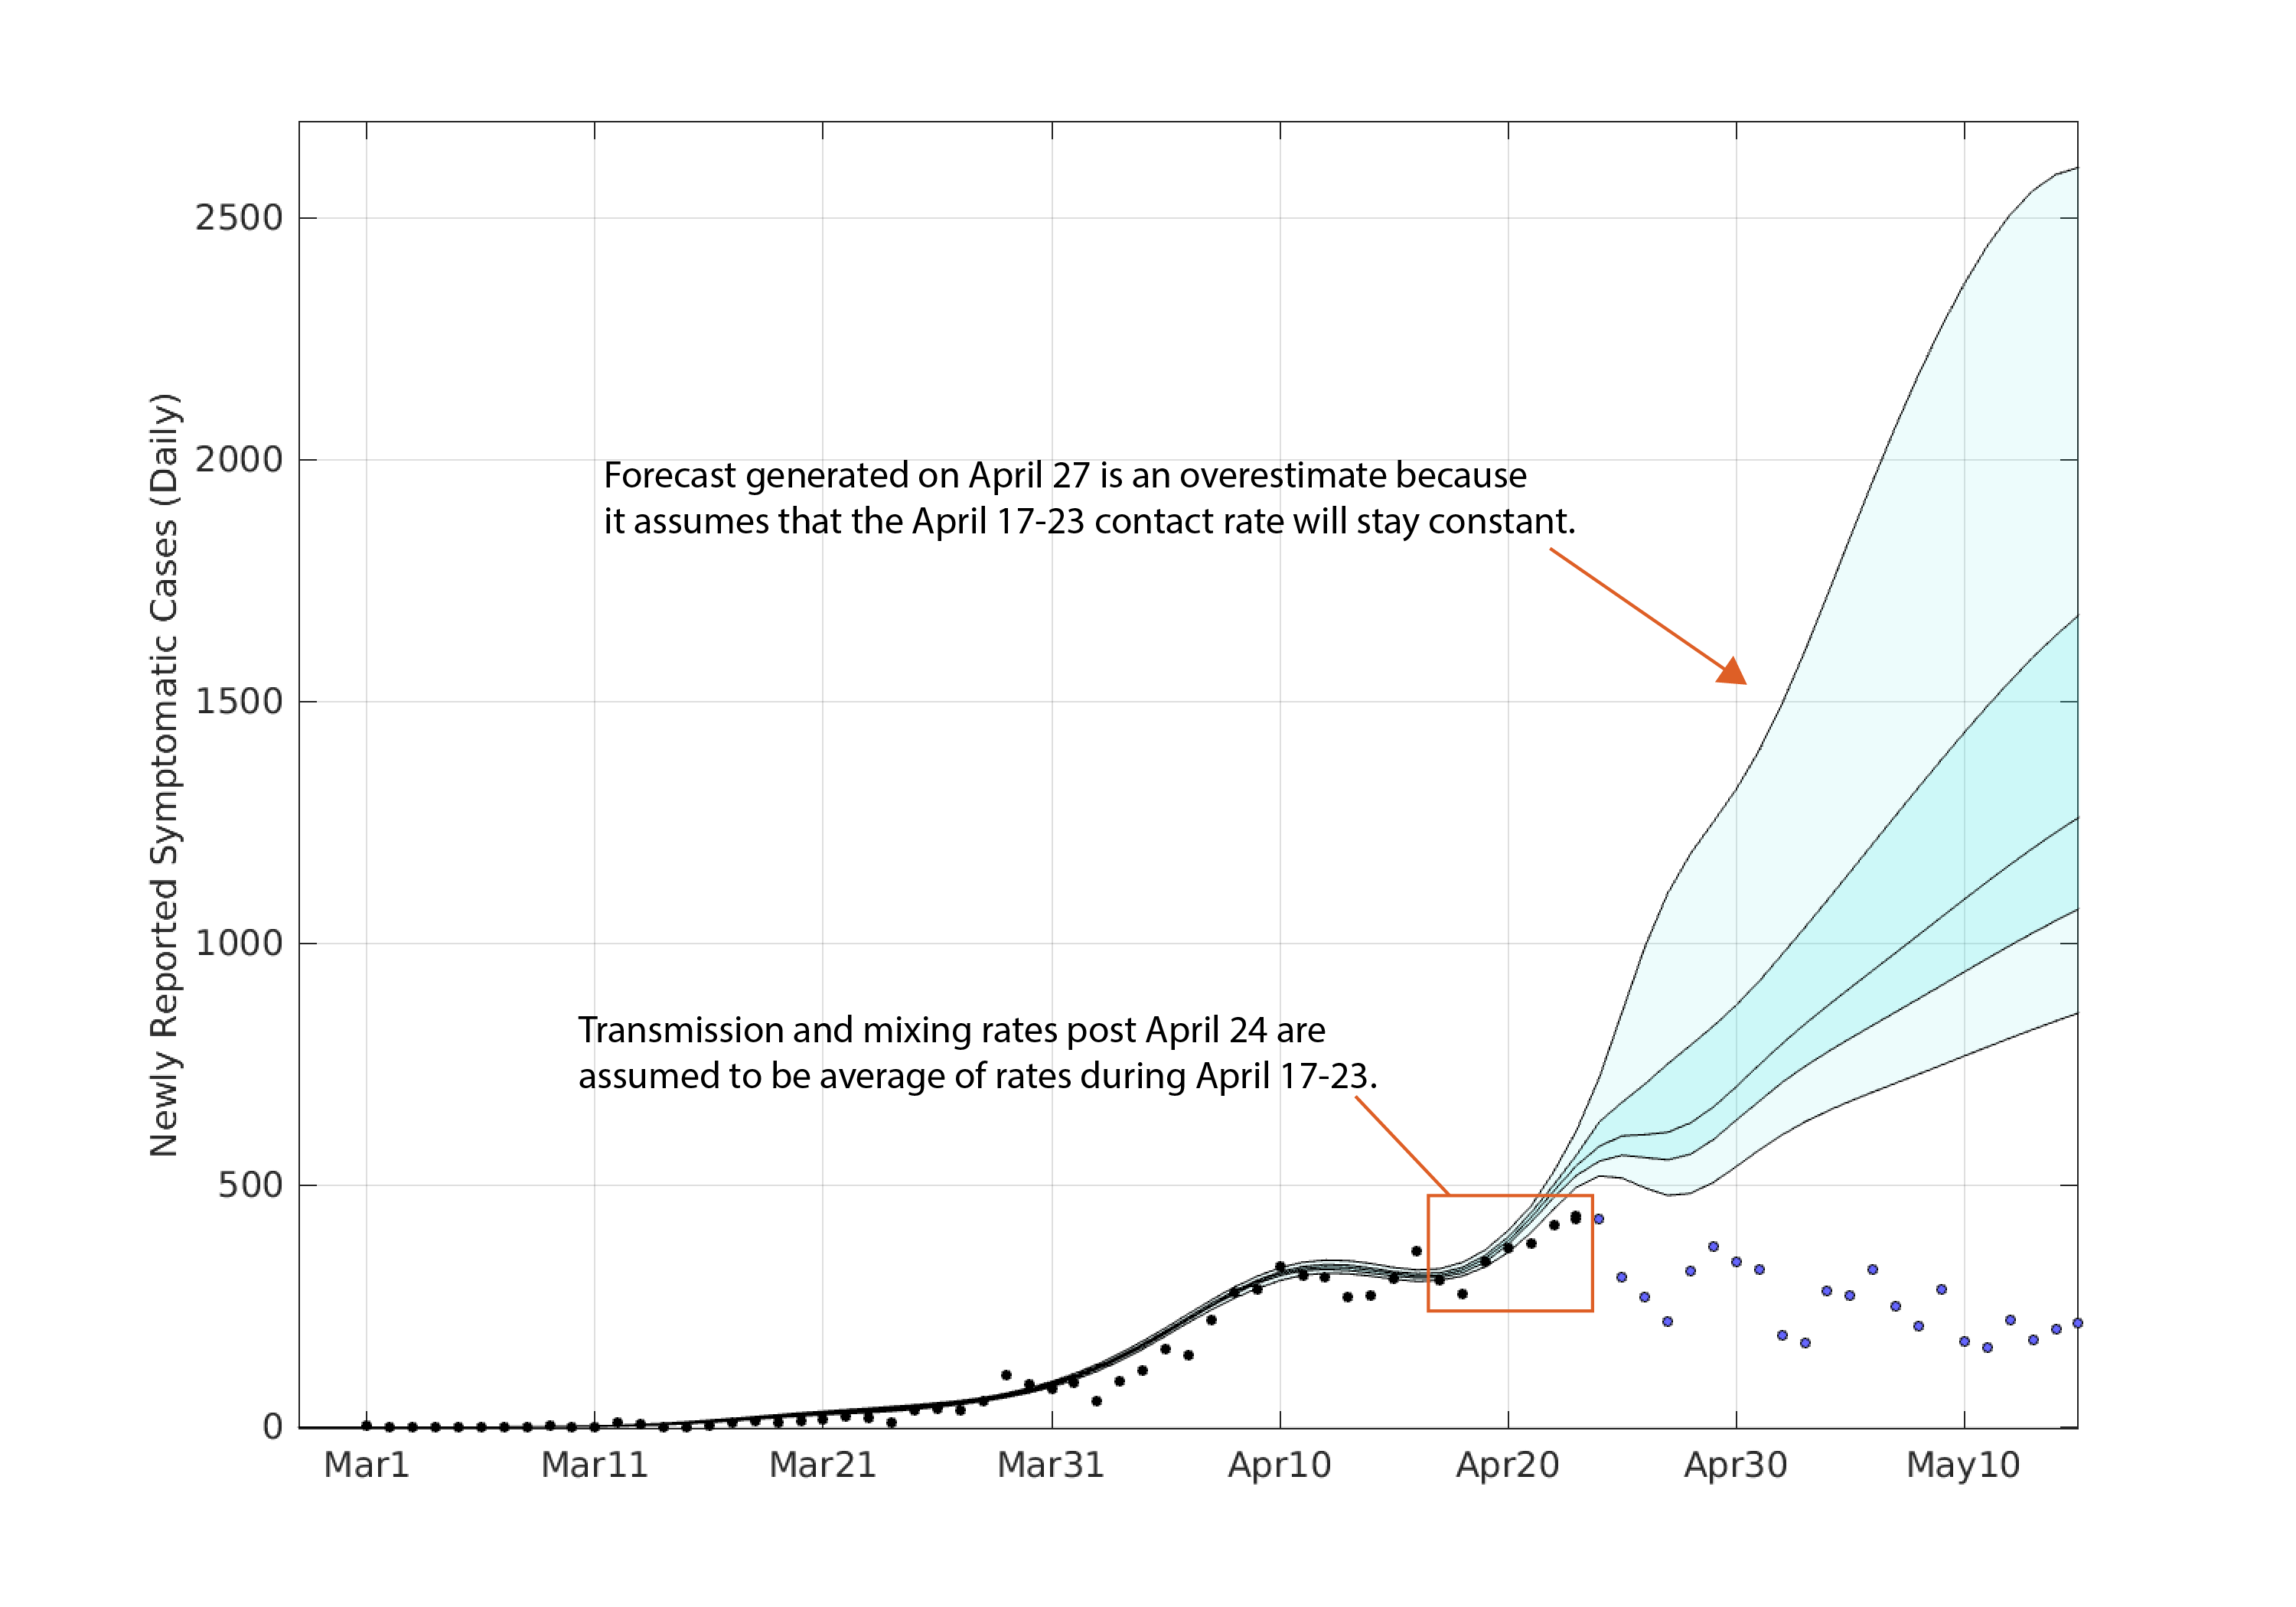
Figure 2. Posterior distribution for mean daily incidence trajectory as predicted by the ODEs. The central black line is the posterior median trajectory. The darker shaded region shows the posterior interquartile range and the lighter shaded region shows the 95% credible interval. The trajectories after April 23 were assumed to have a β-value equal to the mean of the last week’s median β-values.
Again, because of the degrees of freedom in the contact parameters, the mean epidemic process from March to approximately April 20 is overfit, and the posterior indicates there is little uncertainty in the mean daily incidence. Note that observation uncertainty has not been accounted for here. To generate a forecast from April 24 through to May 15, we took the mean of the posterior distributions (of β) over the last seven days and assumed that this mean contact rate would stay constant through time.
The forecasted median number of new symptomatic COVID cases reporting on May 15 is 1260 (IQR: 1071–1678). The 95% credible interval for this forecast is 856 — 2604.
Limitations
The present analysis shows too little uncertainty in its inferred estimates and distributions as (1) observation error has not been accounted for and we are simply showing uncertainty in the mean process, and (2) data on hospitaliations have not been incoroporated into our fitting procedure.
It goes without saying that it is incredibly difficult to forecast an epidemic process when the population’s contact and mixing behavior can change on a daily basis. Public health directives can also change without notice causing people to mix more or less depending on re-openings of certain parts of society or new closings. We know of no other way of forecasting the near-term mixing other than to assume that it will stay close to recently seen levels of mixing. For this reason, the mean population-level contact rate fro April 16-23 was used as the assumed contact rate from April 24 to May 15.
Inevitably, this assumption on the future contact rate can only lead to two outcomes: cases will rise or cases will decline. The mean incidence will remain constant only if R (the effective reproduction number) is exactly equal to one. Certainly, cases can appear to be constant for a short period of time due to stochasticity or if R is very close to one, but forecasts assuming a fixed contact rate in the near-term will typically show simple increases or simple declines based on recent trends.
Updates and Corrections
May 13 2020 — this analysis assumed that 25% of all infections were reported to the health system. Our subsequent inference estimates the reporting parameter at ρ=0.71 (95% HPD: 0.46 – 1.0).
May 18 2020 — the forecast in this preliminary analysis was based on the assumption that recent, averaged contact rates could be used to forecast future contact rates. In effect, this is a scenario evaluation. It tells you what the future would look like if population mixing stays constant at its current levels. We have no evidence indicating whether contact rates should or should not change in the near future. The updated graph below shows our April 27 forecast with the actual incidence data plotted.