May 17 2020
Preliminary Analysis
Summary
For Massachusetts, we analyzed case reporting and hospitalization data from March 9 through May 6 in order to infer changes in population mixing since early March, to estimate the proportion of symptomatic infections reporting to the health system, and to evaluate scenarios where social and physical distancing are somewhat relaxed. From early March to late March, the degree of physical contact and social mixing in Massachusetts appears to have dropped by about 50%. By mid-April, population-level mixing was at about 30% of its early-March levels. Relaxing social distancing measures in Massachusetts is likely to result in the return of an epidemic growth phase with increasing case numbers and hospitalizations.
Background
In Massachusetts, the first two cases of SARS-CoV-2 were confirmed on February 1 (returning traveler from Wuhan, 8th case in the United States) and March 2 (returning traveler from Italy). After March 2, new cases began to be reported nearly every day with a total of 41 cases reported by March 9. After March 9, daily case counts became available. On March 10, Massachusetts issued a state of emergency. On March 11 and 12, new screening, hygiene, and visitation policies were put into place at elderly care facilities. On March 13, gatherings of >250 people were prohibited. On March 16, K-12 schools were closed. On March 23, non-essential businesses were ordered to cease in-person operation. And, on March 24 a stay-at-home advisory was issued.
By May 6, Massachusetts had confirmed more than 72,000 COVID-positive cases and suffered 4420 deaths.
Methods
Details are listed on our Methods Page. Briefly, we assembled data from CovidTracking.com and the Massachusetts Department of Public Health, checked for consistency, and used MassDPH data if there were any discrepancies. In the analysis presented here, we used age-structured symptomatic case data, age-structured incidence of hospitalization, and current hospitalization data.
An ordinary differential equations (ODE) model was used to represent clinical progression and the population-level virus transmission process. The level of contact and mixing was modeled by the parameter β which was allowed to vary over time using a cubic-spline basis with interior knots spaced seven days apart. A total of eight spline parameters were used to fit 59 days of case data. This structure allowed for substantial flexibility in the fitting of the β-values during a period when the population’s mixing behavior was changing unpredictably.
A likelihood function linked the data to the ODE model, and an MCMC approach allowed us to infer some of the parameter estimates described below. A fraction ρ of symptomatic cases are reported to the health system, and the delay from symptoms to hospitalization is used to infer the reporting parameter ρ.
Results
Parameter Estimation
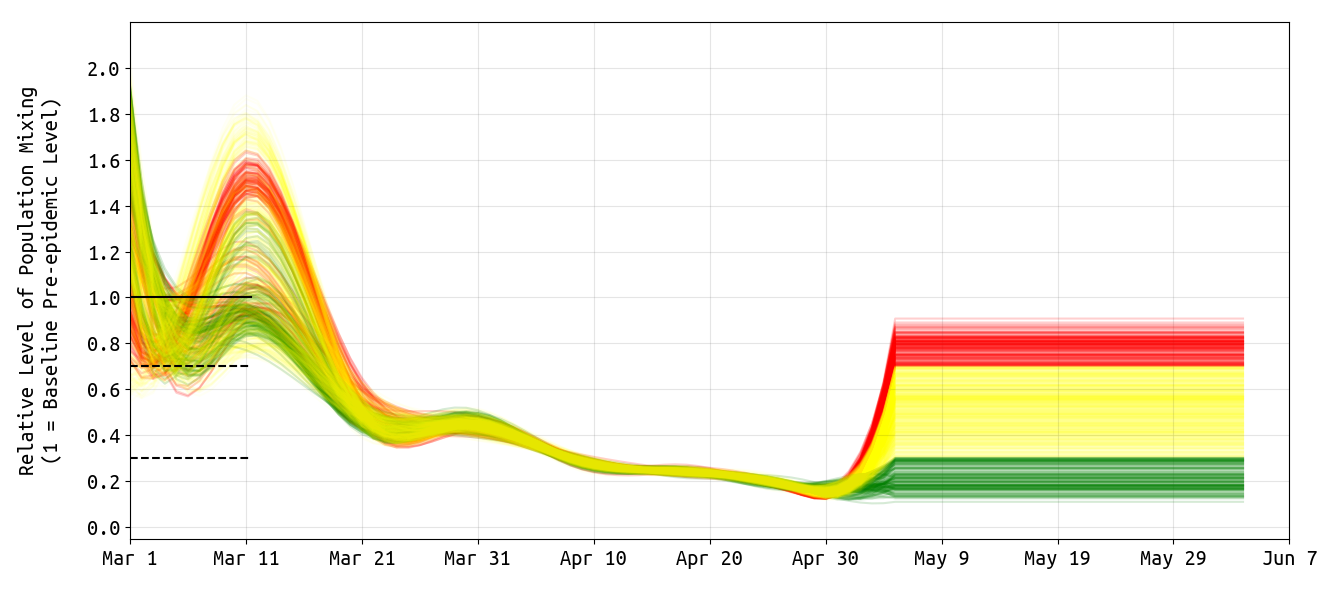
As in our previous analysis, posterior distributions for daily β-parameters were rescaled by the mean β-value between March 1 and March 10, representing the first ten days of the known epidemic in Massachusetts, but before any social/physical distancting was put into place. Figure 1 shows the posterior distribution of the level of population mixing from from March 1 to May 6.
By late March, population-level mixing and contact patterns had dropped to about 50% of their normal or typical level. Note that there is a lot of uncertainty in the estimates during this early March period as we do not know the exact dates of infection of the first 41 cases. The apparent dip, then increase, followed by a second dip in population mixing is unlikely to find support with additional statistical scrutiny. By the middle of April, contact rates had dropped by about 70%. From May 2 to May 6, uncertainty in the level of population mixing increases again as it is always difficult to have high certainty in very recent contact rates since the majority of cases have not completed (and some have not begun) their clinical progression as it is observed by the health system.
An analysis by the London School of Hygiene and Tropical Medicine shows an approximate 45% contact level reduction in Massachusetts from March 9 to mid-April; our estimate for this time period is around 70%.

Figure 1. Posterior distribution for daily β-parameters that represent mixing and social/physical contact in the population. Each line shows one draw from the posterior of β-values. We consider the first ten days of March as a period when social contact patterns would have been at normal or typical levels for that time of year. These contact patterns reduced substantially from early March to late March, and then continued to drop gradually. Recent contact rate estimates are always associated with substantial uncertainty. On May 6, the 95% HPD interval for the relative β-value is 0.16–0.82, but except for this widening uncertainty there is no evidence that contact rates have gone up recently. The green β-series shows those posterior draws whose May 6 relative mixing level was 0.30 or lower (bottom 12% of the distribution). The yellow β-series shows those posterior draws whose May 6 relative mixing level was between 0.30 and 0.70 (middle 74% of the distribution). The red β-series shows those posterior draws whose May 6 relative mixing level was above 0.70 (top 13% of the distribution). The “extended” lines after May 6 simply show our assumptions for our simulations in Figure 3 below.
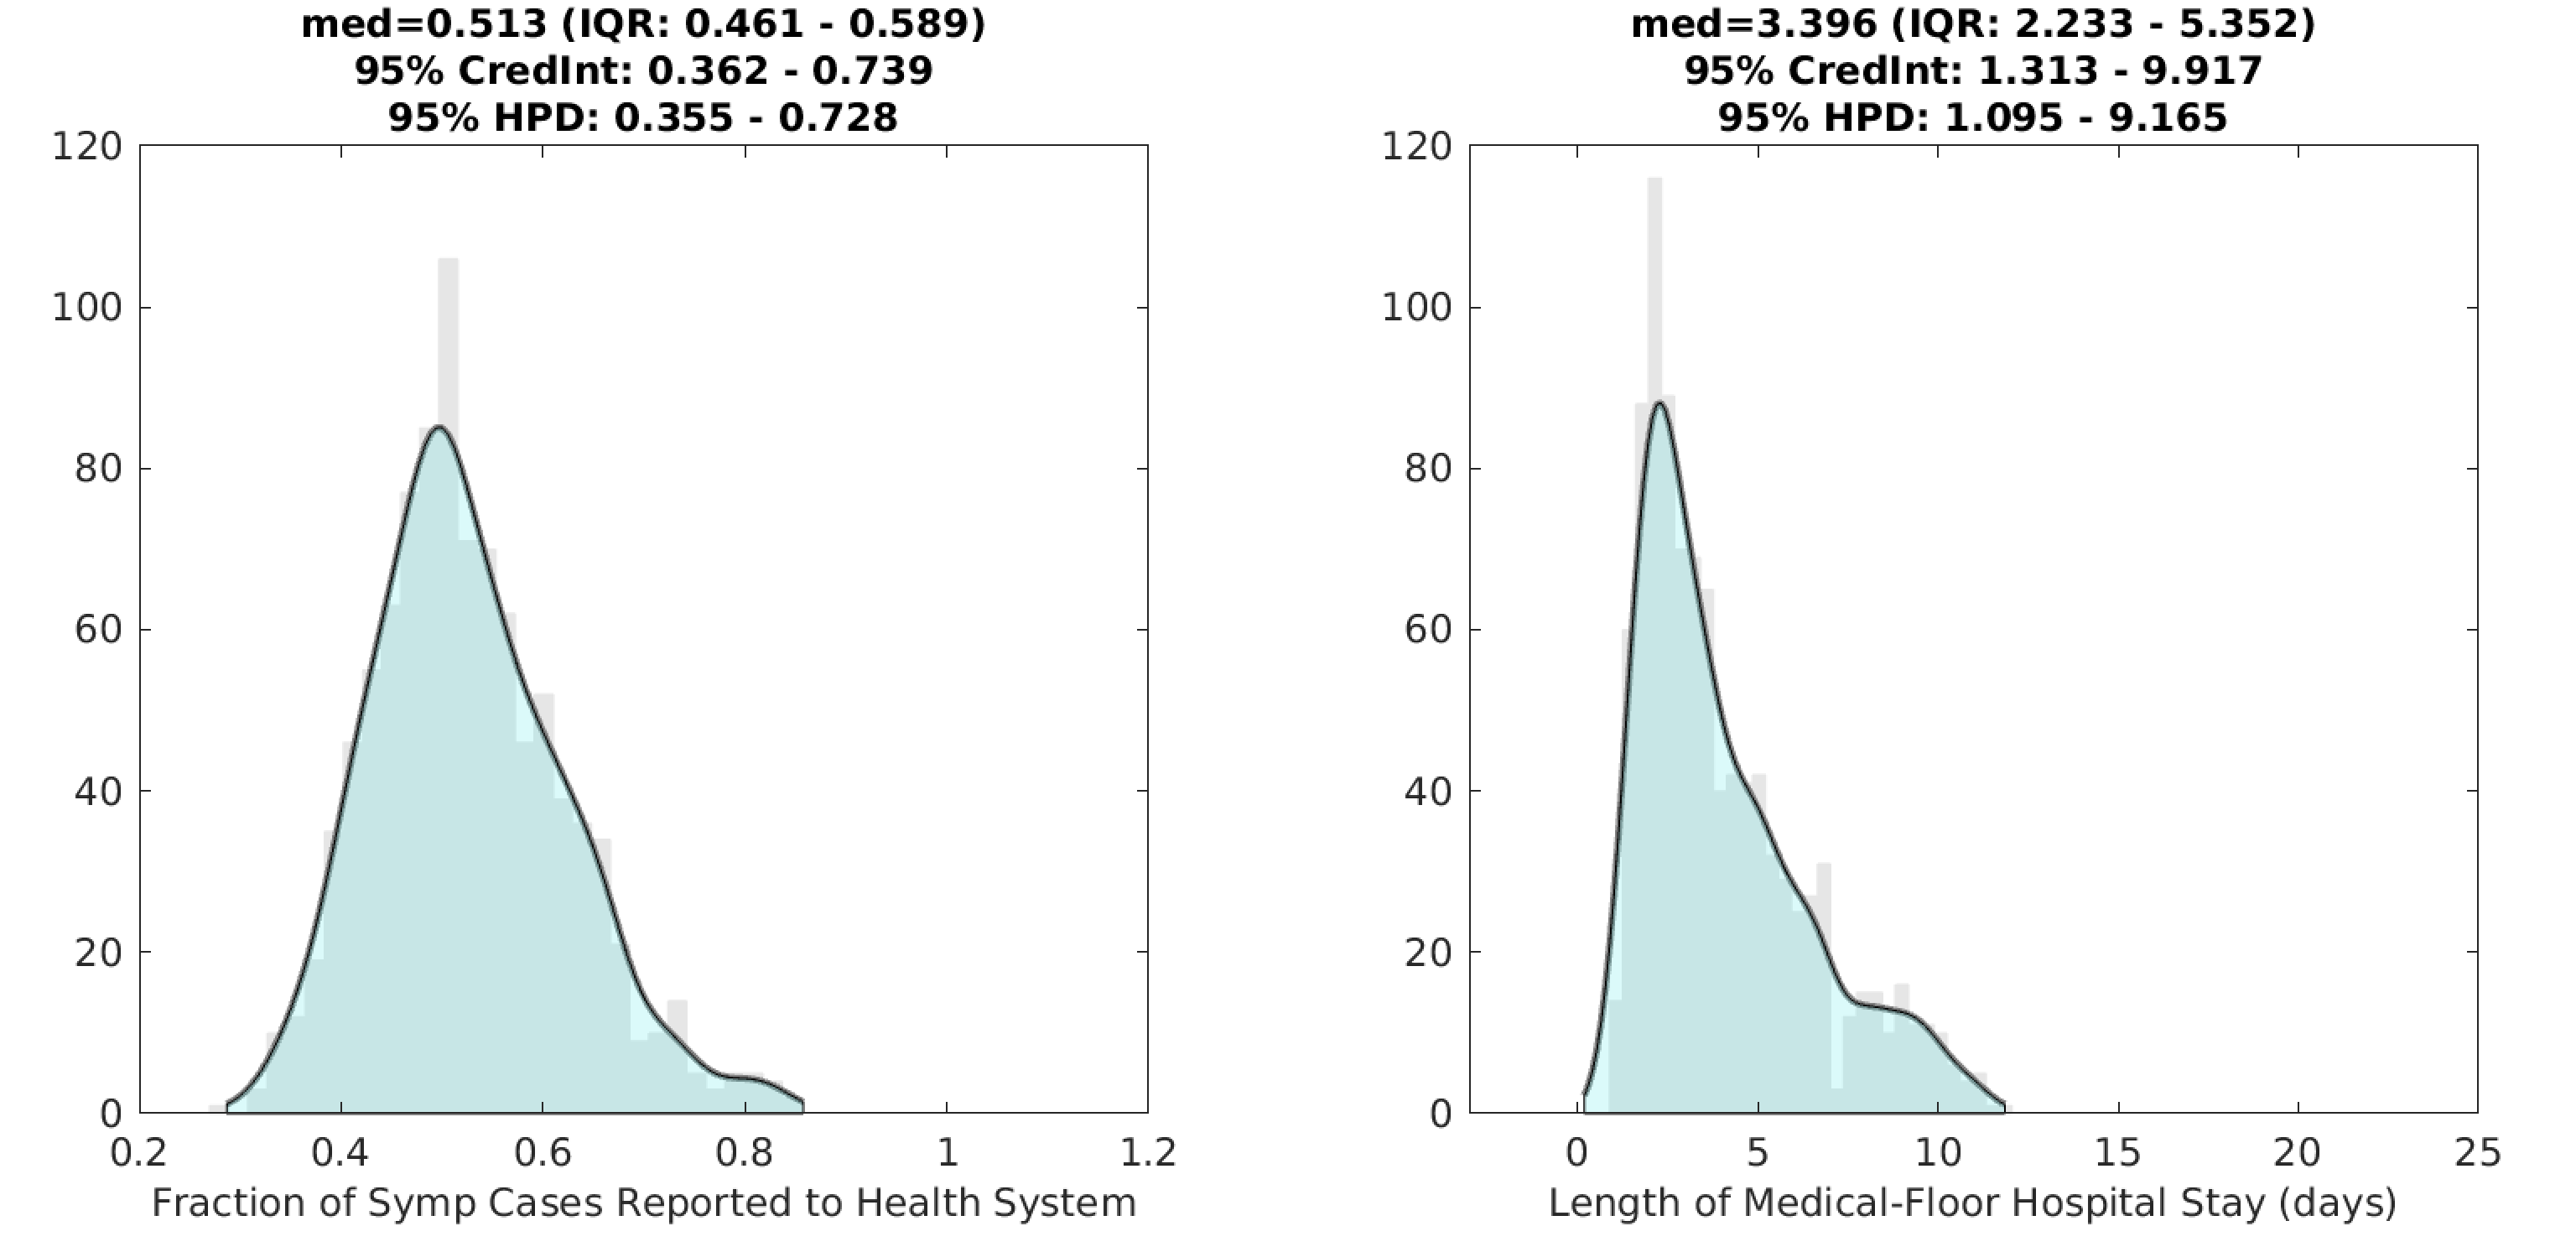
Using the delay from case presentation to hospitalization, we were able to estimate the reporting rate ρ in our observation function. The fraction of all symptomatic cases that are seen and counted by the health system is ρ=0.51 (posterior median) with a 95% highest posterior density (HPD) uncertainty range of 0.36–0.73. This means that about half of all symptomatic cases in Massachusetts are reported to the health system.
This would mean that the 82,182 confirmed cases as of May 14 would translate to approximately 160,000 total symptomatic cases to date. If the asymptomatic fraction is around two-thirds (currently the ODE-model assumption), this would mean that the SARS-CoV-2 attack rate through May 14 is around 7%. As there is uncertainty in the reporting rate and in the asymptomatic fraction, the bounds on Massachusetts’ cumulative May-14 attack rate could range from 3.3% to 13.4%.

Figure 2. Posterior distributions for the reporting rate ρ (left) and the duration of hospital stay (right) for non-ICU patients. Gray bar graph in the background shows a histogram of 1000 samples from the posterior, and the filled green area is a kernel-smoothed density function. Medians, credible intervals, and HPD intervals are shown above each plot. The lenght-of-stay (LoS) in the hospital is currently shorter than has been reported in other studies, and this estimate is to be viewed with caution. An updated analysis will be posted in the coming weeks.
Scenario Evaluation
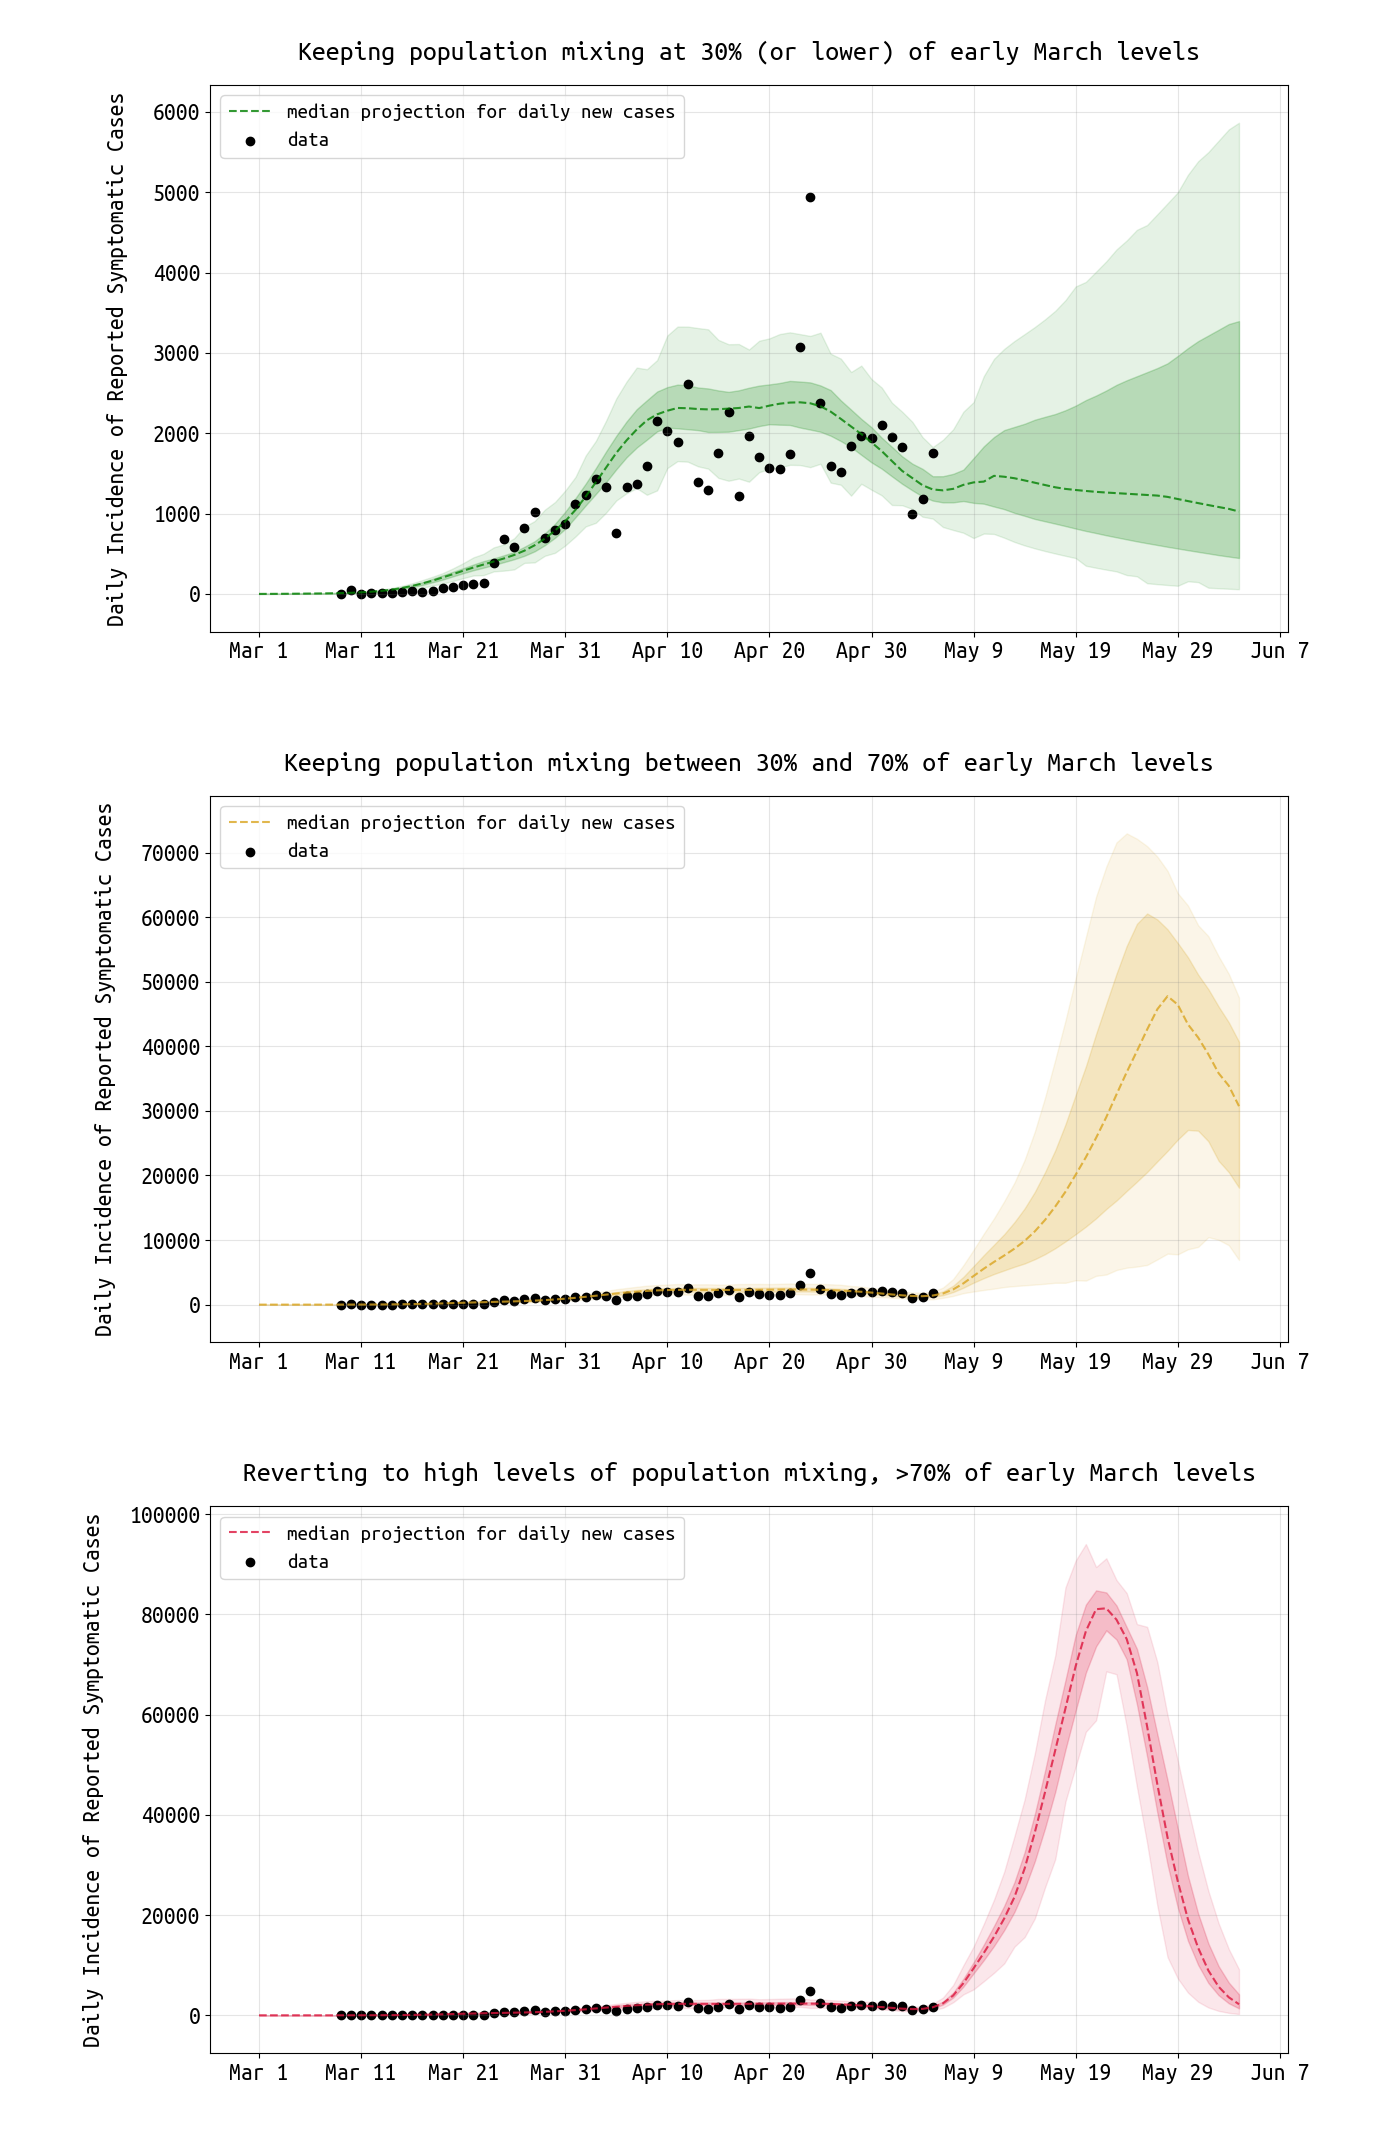
As in our Rhode Island analysis earlier this week, we evaluate three scenarios of mixing and transmission levels for the remainder of May and the first week of June. The β-assumptions for the three scenarios correspond to the colors in Figure 1. In the first scenario (green), we project case numbers and epidemic dynamics forward assuming that population mixing stays below 30% of the original level observed in early March. In other words, this is a scenario with strong social distancing measures still in place, to the same degree as was seen in mid-April. In the second scenario (yellow), we project case numbers forward assuming a partial relaxation of social distancing measures that return social contacts to between 30% and 70% of their original level. In the third scenario (red), we evaluate a scenario in which social distancing returns to its original early March level with no social distancing or physical distancing measures in place; under this scenario mixing levels are >70% of normal levels, as some individuals will continue to distance by choice and higher hygiene standards are likely to be maintained.
When social mixing stays <30% of original levels (i.e. at the mid-April level), the epidemic may be controllable. A similar conclusion was obtained from the Rhode Island data, but the Rhode Island epidemic had a downward slope in a higher fraction of simulations than the Massachusetts epidemic, suggesting that maintaining strict physical/social distancing in Massachusetts may be of critical importance for all of May.
When social mixing is relaxed to 30%-70% of normal levels (i.e. at mid-March to late-March levels), the epidemic rebounds and case numbers increase. Because the susceptible pool in Massachusetts is still very large (>87% of the population), even a modest relaxation of distancing measures would push the virus’s effective reproductive number (R-value) above one and allow the epidemic to begin running its natural course again. A nearly full-sized epidemic would be expected under this rebound scenario.
If social distancing restrictions were removed (mixing at >70% of normal levels), the epidemic would proceed on its unmitigated course infecting >80% of the population.

Figure 3. Projections for daily reported case numbers under three scenarios. In the top scenario, social mixing stays at low levels, <30% of normal or typical mixing levels. In the middle scenario, distancing measures are relaxed and mixing stays at 30% to 70% of normal levels. In the bottom scenario, mixing returns to >70% of normal levels. Black dots are data points. The bands show the interquartile range and the 95% HPD intervals.
Conclusions and Limitations
This is our first analysis of Massachusetts case and hospitalization data, and the estimates and projections will continue to be tested for robustness over the coming weeks. We need to ensure that the hospitalization data (rates and durations of stay) are being accurately reflected in our model. ICU data will be included in our next estimates as well. With more detail and a better understanding of hospitalization counts and stays, there may be changes to our estimate of the reporting rate ρ. Special focus will be paid to the duration of hospitalization estimate which in this analysis appears lower than expected.
As noted in our analysis of Rhode Island data earlier this week, our mathematical transmission model assumes that all individuals have an equal chance of getting infected by any other individual. This is called a mean field model and is an oversimplification of the true social, mixing, and network structure of any population. Individuals also have different levels of exposure by age, city, neighborhood, occupation, socio-economic status, and many other factors. Geographic structure and variation in susceptibility have the effect of reducing rate of spread in the population; based on this, the forecasted case numbers in Figure 3 may be overestimates.
Current attack rate estimates (around 7%) are in line with what would be expected for Massachusetts based on COVID epidemic analysis in other states and countries. The underreporting factor for Massachusetts is estimated to be somewhere between 4 and 8, on the low end of the commonly quoted ‘5 to 20’ figures used for many approximate analyses of recent data.
Using current death counts and current case counts results in an underestimate of the symptomatic case fatality rate (on the upswing of an epidemic). Therefore, the current symptomatic case fatality rate (sCFR) in Massachusetts appears to be a minimum of 3.4% (= ρ · 5482/82182). With an asymptomatic proportion between 0.5 and 0.75, this would imply an infection fatality ratio (IFR) between 0.86% and 1.7%, which is higher than the expected IFR range measured in other states and countries. This may be the result of (1) higher true underreporting than was estimated in this analysis, or (2) a substantially higher proportion of infections in older individuals and elderly care centers during the early stage of the epidemic.
Updates and Corrections
No updates or corrections at this time.