June 30 2020
Preliminary Analysis
Summary
We analyzed case reporting, hospitalization, and death data from Massachusetts from March 1 through June 23 in order to infer changes in population mixing and analyze hospitalization patterns. From early March to late March, the degree of physical contact and social mixing in Massachusetts appears to have dropped by more than 80%. However, there is substantial uncertainty in the baseline mixing-rate estimates for early March. Case reporting in Massachusetts appears to be catching about 47% of symptomatic SARS-CoV-2 infections. Four different hospitalizations data streams were used to reconstruct hospitalization patterns over the past 3.5 months, and these suggest that daily new hospitalization counts are underreported.
Background
To date, Massachusetts has reported more than 108,000 total cases of COVID-19, more than 11,000 hospitalizations, and more than 8000 deaths. Hospitalizations and cases in Massachusetts are likely undercounted by about a factor of two, but as we detail below, certain hospital-based data streams do appear to reflect all or most of the hospitalized population in Massachusetts. The mid-March lockdown lead to decline in daily case numbers that began on April 17, and the decline in case numbers has continued through the last week of June despite society partially re-opening in early to mid May.
Methods
As in last week’s post on Rhode Island’s epidemiological situation, we are now using a new epidemiological model structure. Progression from hospitalization to ICU care now occurs early in the hospitalization period. This change was made after further published evidence and conversations with clinicians in Rhode Island confirmed that the time from hospitalization to ICU admission was in general short. A class diagram of the new model is shown on our methods page. The model now distinguishes between recoveries from mild/moderate infection and hospital discharges. Likewise, deaths at home versus deaths in hospital are separated into different variables, making it possible to fit the model to state-level data that report at-home deaths and hospital discharges. Parameters for at-home death were added to the 60-69, 70-79, and 80+ age groups, although we do not yet have full confidence in the identifiability of these three age-specific death rates using current data. Summary of current parameter estimates is shown here.
Data were sourced from the Massachusetts Department of Public Health’s raw data archive. Hospitalization data needed to be adjusted in several places. First, data on current hospitalizations for April 7-14 needed to be adjusted upwards as the state reported these data for only a subset of hospitals for this short period. Second, underreporting of total COVID-19 hospital admissions is apparent in Massachusetts as the current count of 8000 statewide deaths and 11,000 hospitalizations would only be reconcilable via an extremely high in-hospital death rate. It is much more likely that Massachusetts has seen >25,000 COVID-19 hospitalizations (with underreporting in the MassDPH data) and a hospitalized fatality rate <30%.
Age-structured case and hospital admission data were available for inference of age-specific parameters. Hospital discharge data and in-hospital/out-of-hospital death numbers were not available
A likelihood function linked the data to the ODE model, and an MCMC approach was used to infer the parameter estimates described below. A fraction ρ of symptomatic cases are reported to the health system, and the delay from symptoms to hospitalization is used to infer the reporting parameter ρ. We evaluated a model with two time-dependent reporting parameters, but the results indicated high reporting in early March and low reporting afterwards which is not consistent with clinical descriptions of how the epidemic was being managed and reported in March.
Facebook mobility data were derived from mobile users with location tracking enabled. These were made available by the Covid-19 Mobility Data Network and they are presented here with a summary statistic describing the percentage of users that stayed home on a given day.
Results
Parameter Estimation
As in our previous analysis, posterior distributions for daily β-parameters — representing population-level mixing and contact — were rescaled by the mean β-value between March 1 and March 10, representing the first ten days of the known epidemic in Massachusetts, but before any social/physical distancting was put into place. Figure 1 shows the posterior distribution of the level of population mixing from from March 1 to June 23, as well as a mobility metric desribing the fraction of Facebook users that left home at least once per day.
By late March, population-level mixing and contact patterns had dropped to <20% of their pre-lockdown level. Note that there is substantial uncertainty in the estimates during the early March period, meaning that there could be bias in the estimates of the relative reduction if the baseline (March 1-11) mixing level is estimated poorly. Nevertheless, the mixing-level reduction from baseline is substantial.
As in Rhode Island, higher levels of contact and mixing began to resume in early May. Note that the β-parameter represents both the contact rate among individuals as well as the probability that one individual is able to transmit to another. This gradual resumption of ‘leaving home’ in May was not accompanied by an increase in β, implying that (1) hygiene and distancing habits had improved from March to May and that the re-opening of society was accompanied by an increased awareness of the new behaviors that would be necessary to keep infection levels low, and/or (2) the re-opened parts of society were a minor contributor to infection dynamics in early March.
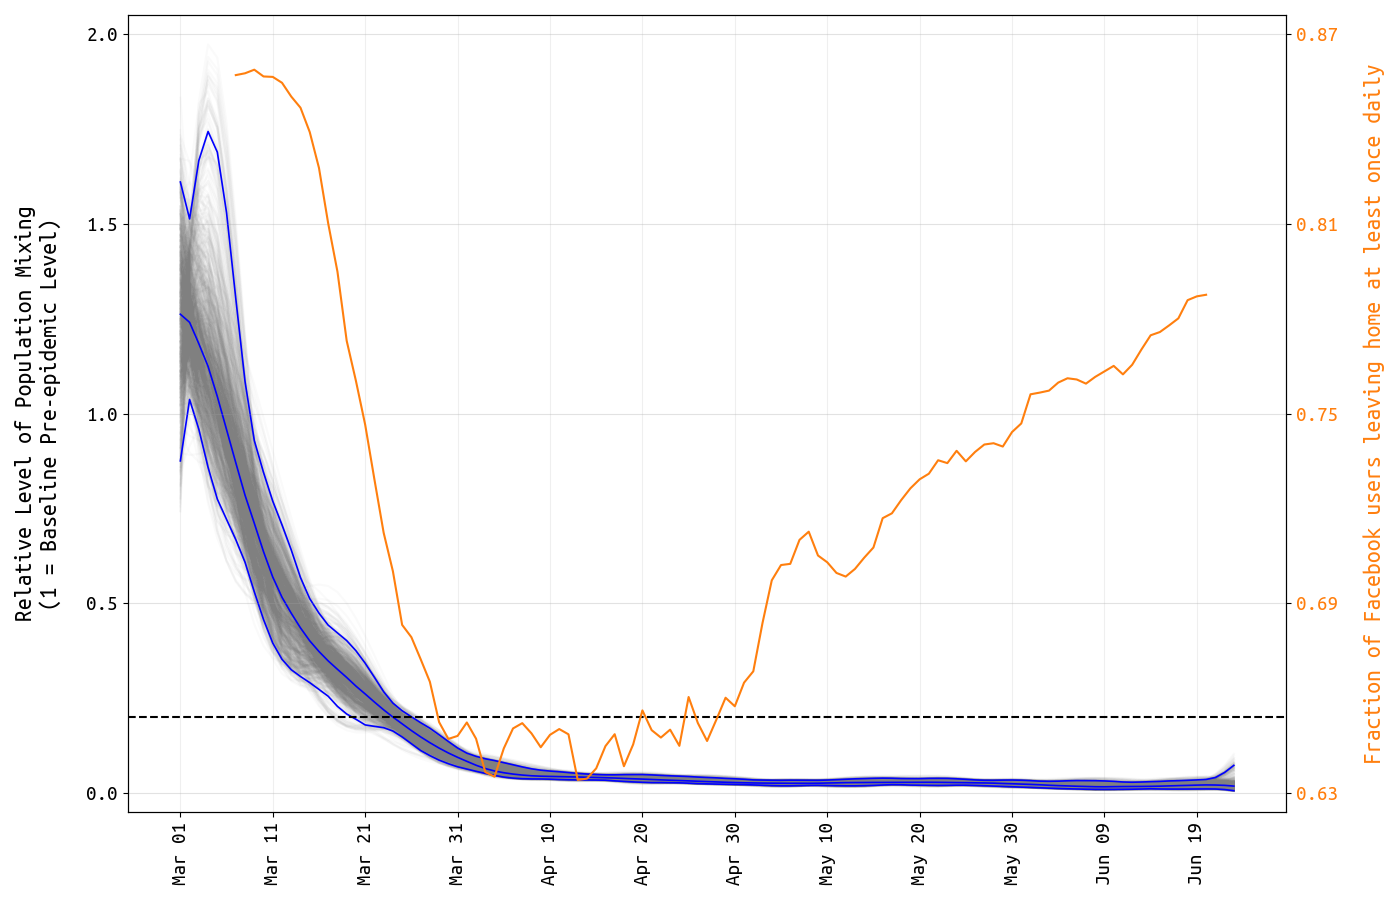
Figure 1. Posterior distribution for daily β-parameters that represent mixing and social/physical contact in the population. The blue lines show the posterior median and 95% credible region, and the light gray lines show individual mixing time series drawn from the posterior. The mixing level is rescaled so that the mean from March 1 to March 11 is 1.0. The dashed line indicates 0.2. The yellow line shows the fraction of Facebook users in Massachusetts that left home at least once per day.
Using the delay from case presentation to hospitalization, we are able to estimate the reporting rate ρ of symptomatic COVID-19 infections, i.e. the fraction of all symptomatic cases that are seen and counted by the health system. Our estimate (posterior median) is ρ=0.47 (95% HPD: 0.39–0.58), which is consistent with our estimate of 0.51 in mid-May. About half of all symptomatic cases in Massachusetts are reported to the health system.
This would mean that the 108,443 confirmed cases as of June 27 would translate to approximately 231,000 total symptomatic cases to date. If the asymptomatic fraction is around half (currently the ODE-model assumption), this would mean that the SARS-CoV-2 attack rate through June 27 is around 6.7%. Note that our estimate from May was slightly higher due to the fact that we were assuming a higher proportion of asymptomatic infection.
As there is uncertainty in the reporting rate and in the asymptomatic fraction (possible range from 0.5 to 0.75), the bounds on Massachusetts’ attack rate through June 27 are 5.4% to 16.1%.
An updated analysis on clinical parameters shows that our May estimate of hospital length-of-stay was an underestimate as expected. Currently, we estimate that the average medical-floor hospital stay lasts 6.8 days (95% HPD: 5.7–7.8). Although ICU populations are not broken down by age in MassDPH data, we can estimate that the probabilities of progressing from hospitalization to critical care are approximately 12% (age <40) and 18% (age >40).
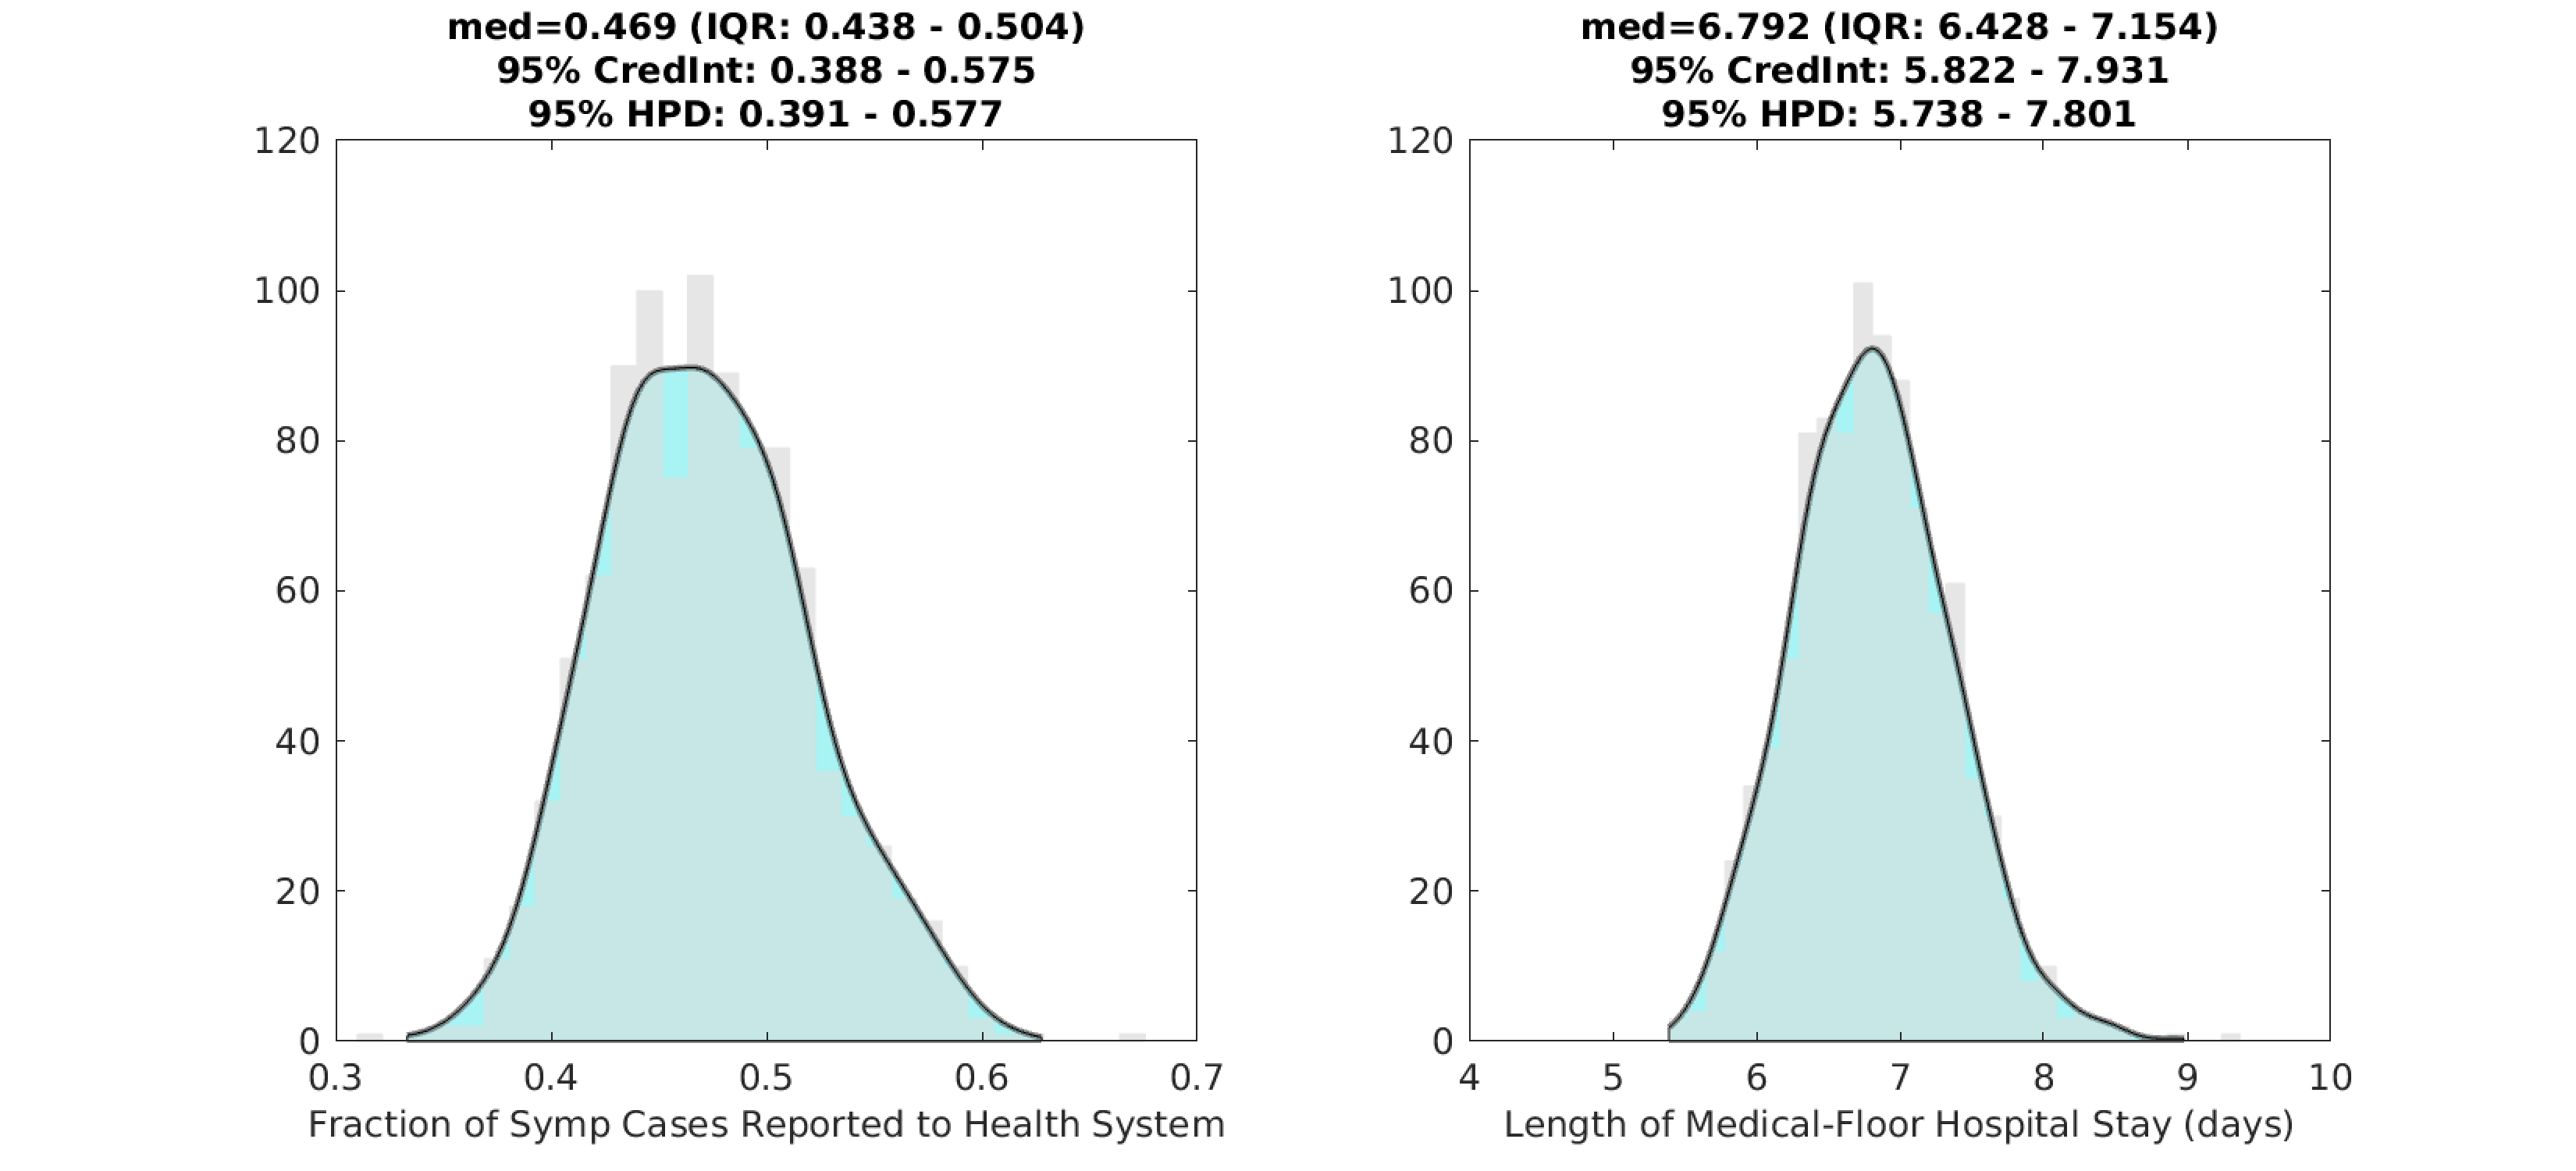
Figure 2. Posterior distributions for the reporting rate ρ (left) and the duration of hospital stay (right) for non-ICU patients. Gray bar graph in the background shows a histogram of 1000 samples from the posterior, and the filled green area is a kernel-smoothed density function. Medians, credible intervals, and HPD intervals are shown above each plot.
Reporting of hospital data in Massachusetts
As in other states, Massachusetts reports both new hospital admissions and number of patients currently hospitalized. However, in MA, these numbers appear to come from different sources. As an example, the cumulative counts of hospital admissions were 1068 on April 4 and 4752 on April 24. The reported numbers of currently hospitalized patients for those dates were 1869 (April 4) and 3830 (April 24). Certainly, by April 4 we could not have seen 1068 total cumulative hospital admissions and also have had 1869 patients in hospital on that same day. In addition, it is also impossible that on April 24 there were 4752 cumulative hospitalizations and 3830 current hospitalizations. This would mean that of all 4752 recorded hospitalizations during the first eight weeks of the epidemic, 80% were still in the hospital on April 24 and only about 900 had either been discharged or died. This would imply a long multi-week length of hospital stay which is inconsistent with most clinical data. It is also inconsistent with the 3000 deaths reported in Massachusetts by April 24.
The simplest explanation is that the daily hospital admission counts are being reported from a subset of hospitals that represents a fraction of the total patient pool. Currently, we estimate that 40% of daily hospital admissions are being reported to MassDPH. This underreporting fraction is currently fixed (i.e. not estimated) in our statistical analysis.
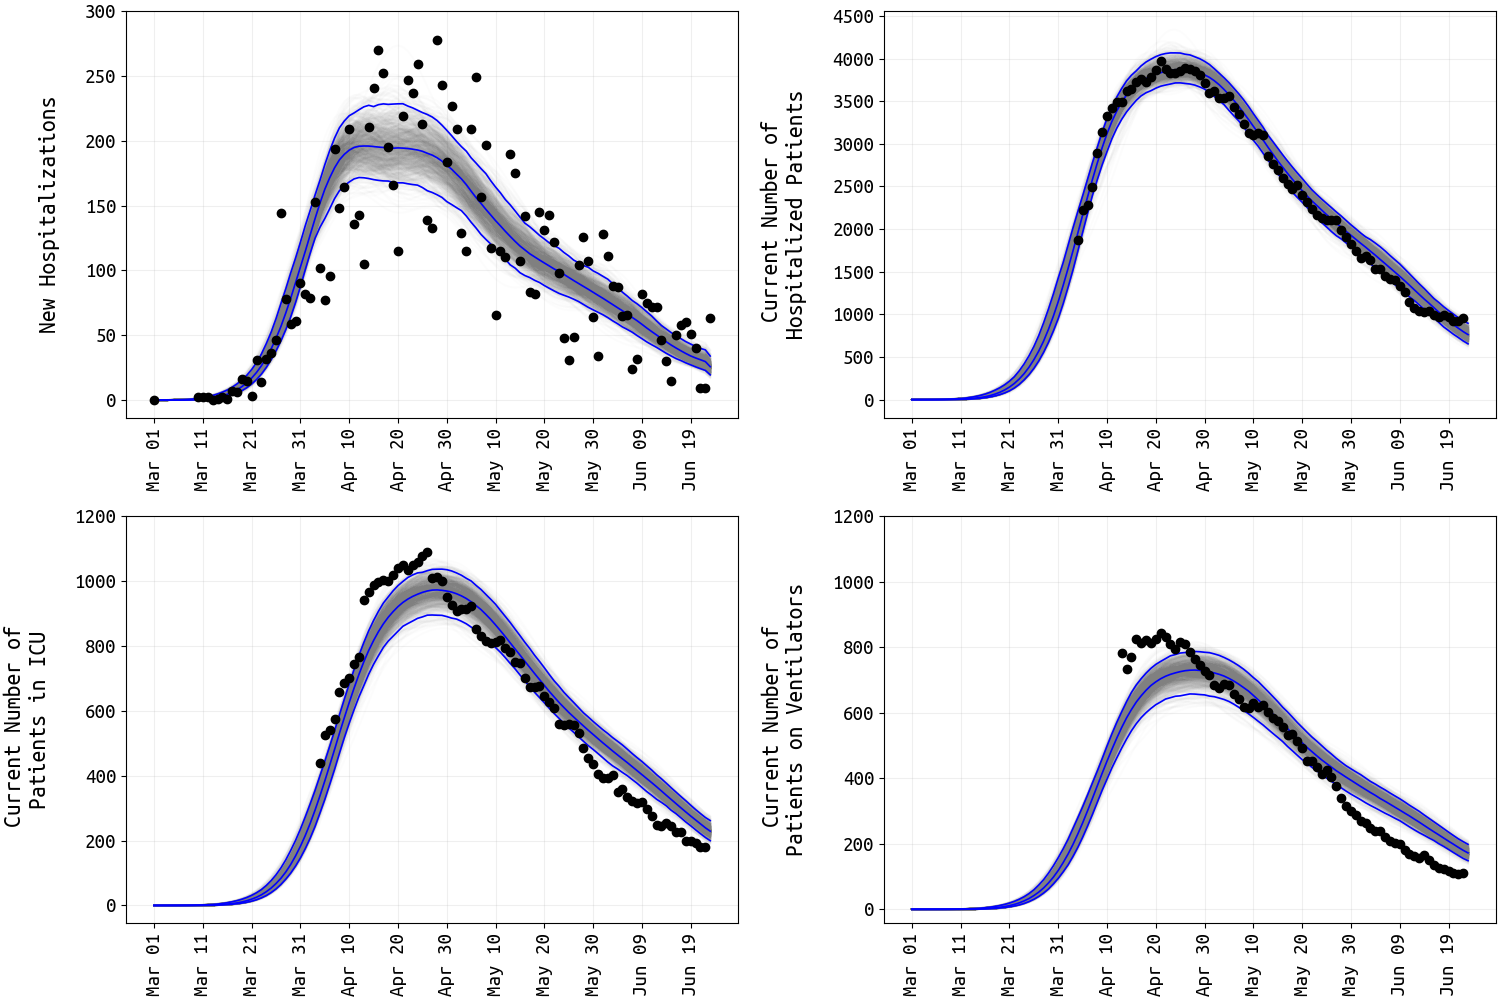
Figure 3. Four different hospital data streams (black dots) and posterior distributions of the mean ODE epidemic process (medians and 95% credible intervals shown). Note that obsevation error is not accounted for in the 95% credible intervals. New daily hospitalizations (top left) show substantial day-to-day variaion as this data stream tracks daily hospital admissions. The mean ODE process for daily hospital admissions has been multiplied by 0.4 to account for underreporting. Current numbers of patients in hospital, ICU, and on ventilator show less variation as these quantities are auto-correlated more strongly in time.
Active surveillance and passive surveillance
As of June 27 2020, Massachusetts had administered more than 826,000 PCR tests for SARS-CoV-2, with approximately eight to ten thousand tests done per day since mid-April. However, some of these tests are done on suspected cases that present to hospitals or clinics with COVID-like symptoms (this is called passive surveillance), and some are carried out as parts of wider testing campaigns in elderly care residences or in groups of individuals that are more vulnerable to infection or disease but do not necessarily show symptoms (this is active surveillance). In May, at least 40,000 PCR tests were administered in elderly care homes and at EHS surveillance sites accounting for more than 10% of all tests in May. Although active-surveillance testing data outside the April 30 to May 27 window are not currently available, it may be reasonable to assume that about 10% of molecular diagnostic tests administered in Massachusetts have come as part of active surveillenace programs (Figure 4).
In order to incorporate active surveillance into statistical estimates of (1) current transmission, (2) cumulative attack rate, and (3) remaining population susceptibility, inclusion criteria and design approaches need to be known for active surveillance programs. For example, whether tested individuals represent all present in a group or sub-population, contacts of known cases, mildly symptomatic patients, or symptomatic patients only, makes a difference in how time-dependent transmission rates are inferred. In general, the larger the active surveillance component the lower the underreporting factor (or inflation factor) that is commonly used to translate reported cases into total infected case counts.
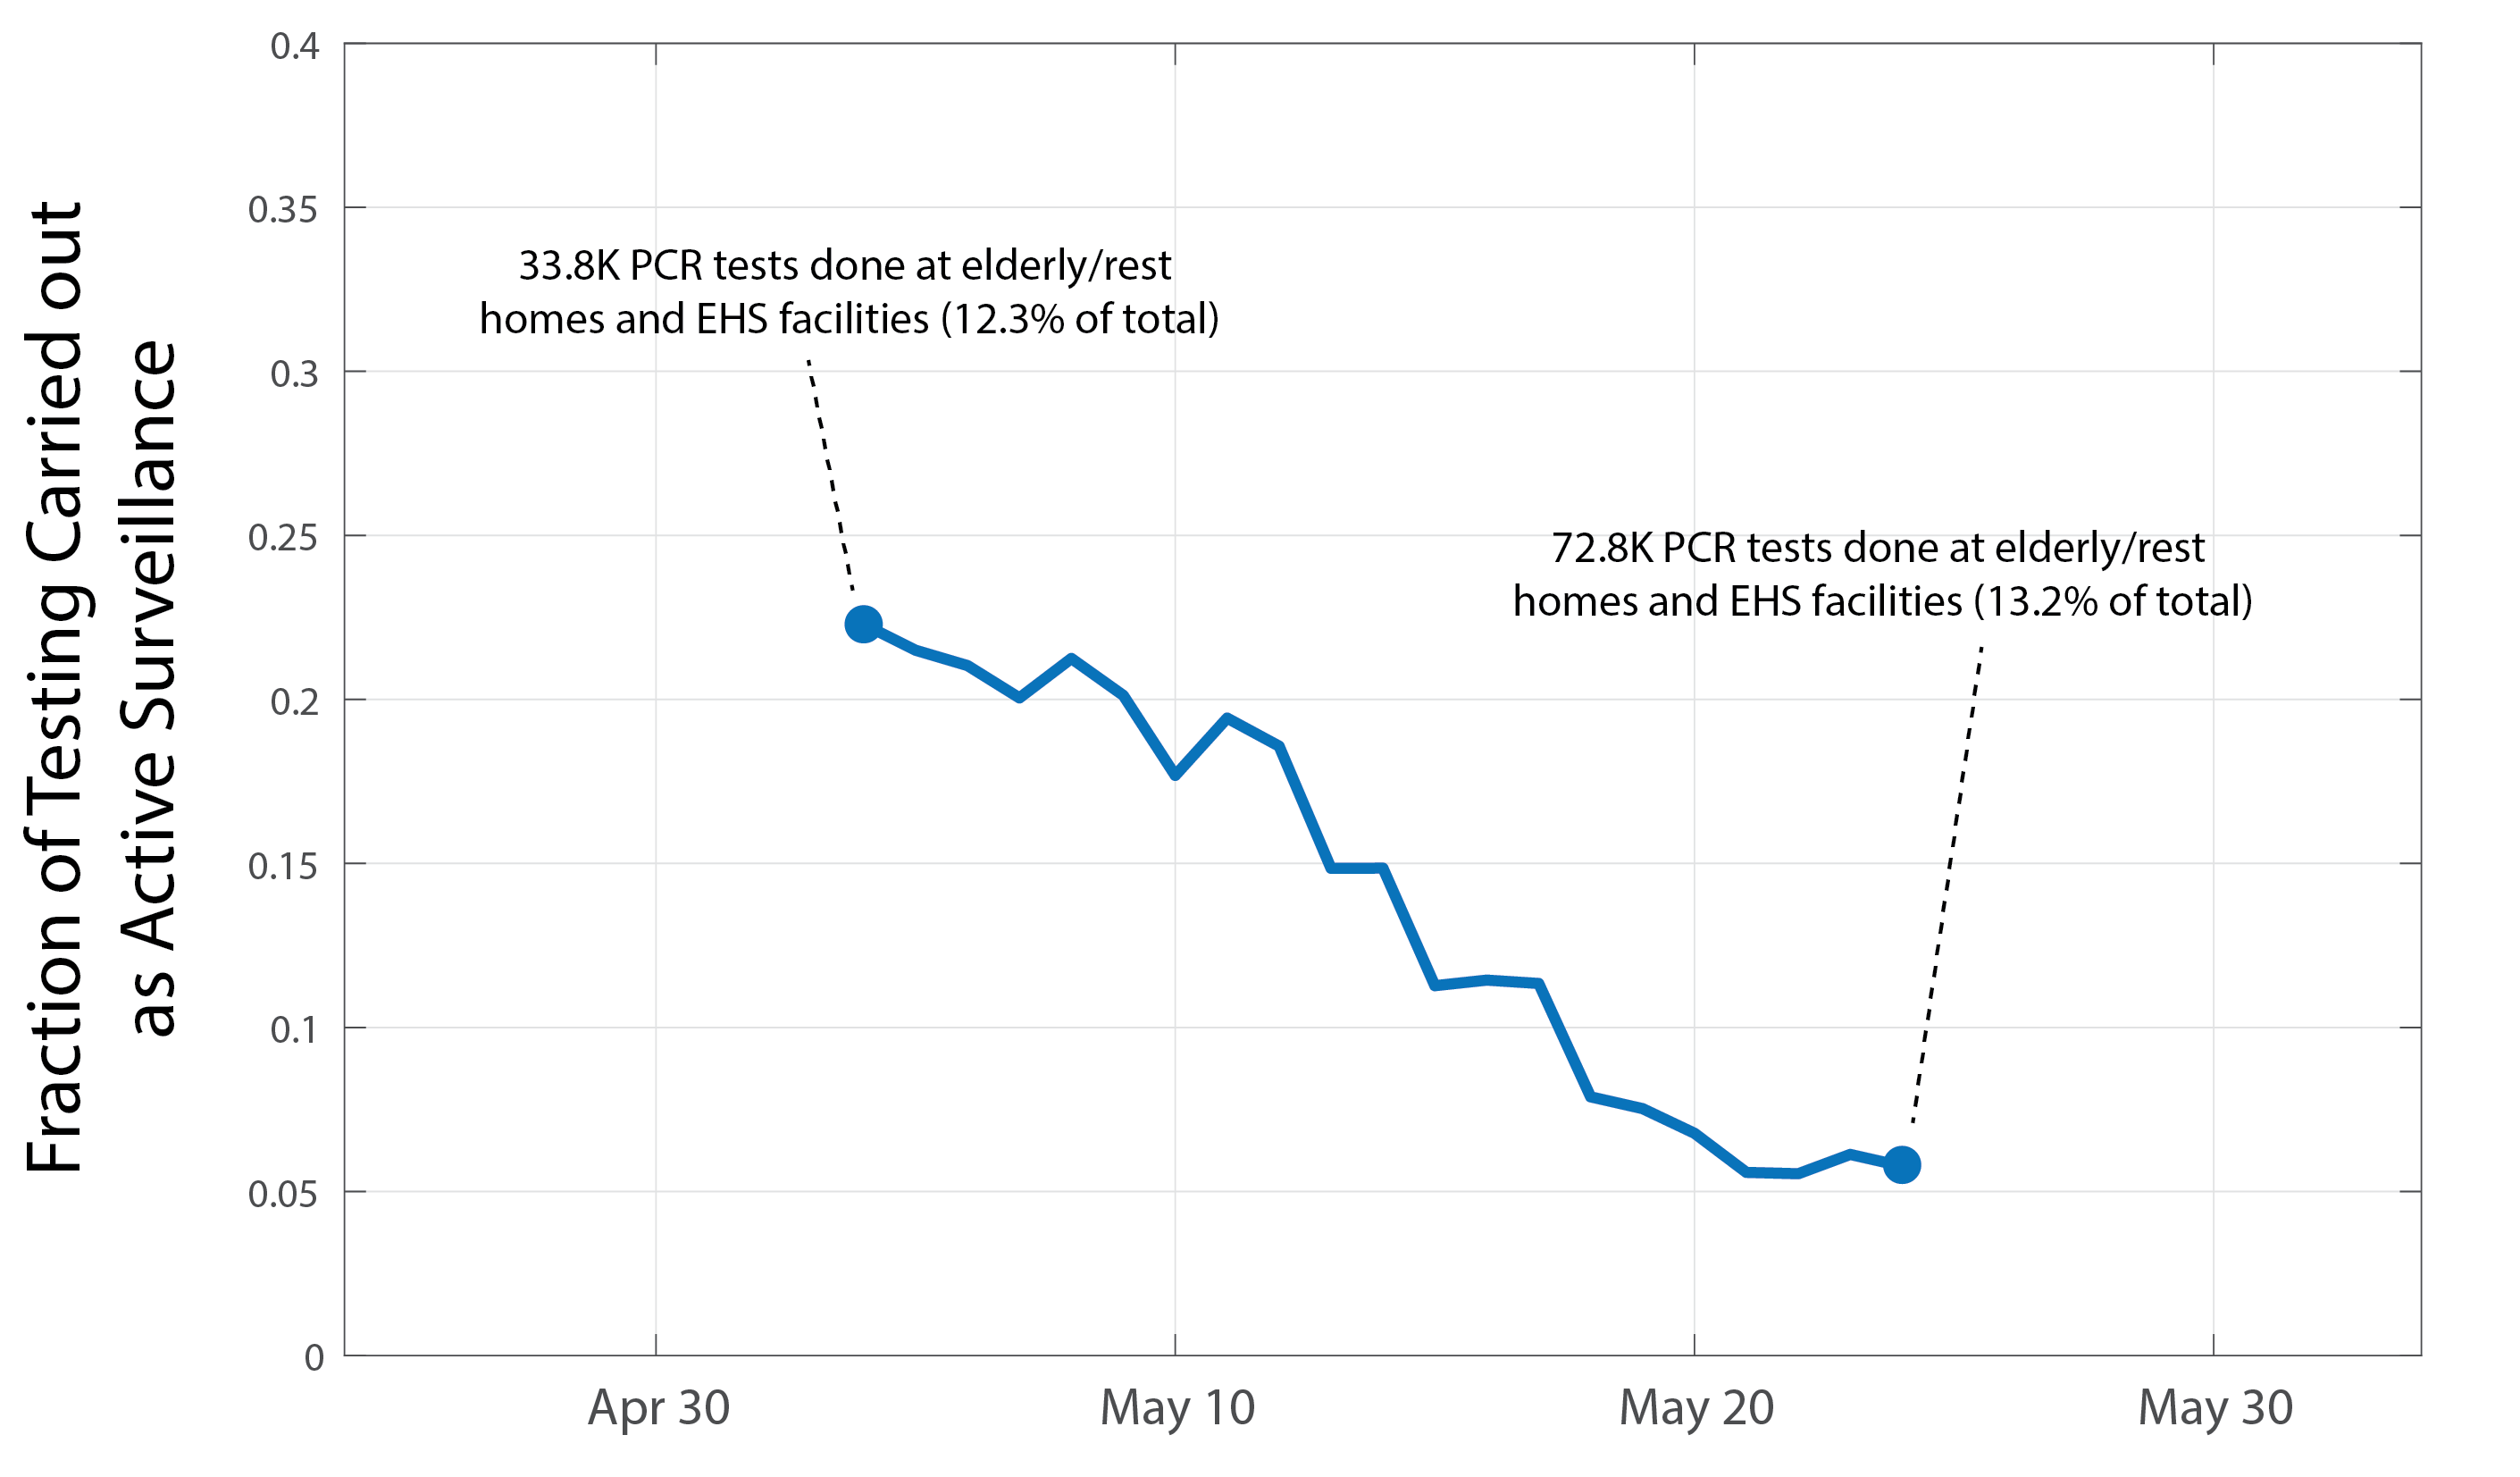
Figure 4. By day, fraction of PCR tests for diagnosis of SARS-CoV-2 infection that were administered as part of active surveillance programs in Massachusetts. Data are shown as a 7-day moving average and are only available for May. Text insets describe the cumulative number of tests performed as part of active surveillance.
Conclusions and Limitations
Current attack rate estimates, between 5.4% and 16.1%, suggest an infection underreporting factor of 3.5 to 10. This means that the 108,443 currently reported cases could correspond to anywhere from 380,000 to 1.1 million total cumulative infections in Massachusetts. If the current successful trend of suppressed transmission continues in Massachusetts, the cumulative confirmed case count will reach approximately 125,000 to 130,000 by the time public schools are scheduled to begin instruction. Under this scenario, the proportion of the Massachusetts population that has been infected (and is potentially immune) is expected to be around 8% (range: 6% to 19%) when schools reopen.
An external constraint on our inferred total case counts is available in the form of independent estimates of the Infection Fatality Ratio or IFR – the proportion of infections, across all ages, that lead to death. Serological studies on multiple communities experiencing large outbreaks in the Spring of 2020 have yielded IFR-estimates between 0.5% and 1% of infections. When we compare this with our results, IFR estimates for Massachusetts range from 0.73% to 2.1%. Such a high IFR-estimate in MA may be explained by a large amount of infection among older cohorts that are known to be vulnerable to the worst outcomes of infection, especially in long-term care facilities and nursing homes. It may also be the result of a higher underreporting rate than estimated here.
Statewide hospital reporting becomes more difficult with both larger and more complex hospital networks. In Massachusetts, current COVID-positive patient counts appear to represent the entire state’s hospitalized patient population. However, daily admissions data seem to catch only about 40% of newly hospitalized cases. Uniform reporting, a hierarchichal notifiable disease system, definitions of catchment areas, and hospital-admission counts reported by hospital would all increase confidence in the ‘new hospitalizations’ data stream as an early warning signal of a rebound and a representative assessment of current statewide disease burden.
In general, for Massachusetts and for all states, active surveillance methods and results should be reported systematically every week to public health data collection systems in the same way that testing numbers and positive case counts are currently reported. Understandably, this reporting system is difficult to put into place in the middle of a large epidemic wave, especially in an epidemiological setting that is not used to repeat pathogen emergence events and routine reporting of severe/deadly infectious disease incidence. During summer, if incidence remains low, improving the data reporting system should include three priorities: (1) positivity rates and case counts from contact tracing efforts, (2) inclusion criteria and positive/negative case counts from active surveillance, and (3) a categorical variable for patients’ self-reported source of infection if known and available.
Updates and Corrections
No updates or corrections at this time.