June 23 2020
Preliminary Analysis, New Model Version
Summary
Using COVID case data, hospitalization data, and death data from Rhode Island, we are able to infer the level of population mixing from early March through mid-June. The percentage of Rhode Islanders infected through June 16 is small, ranging from 3.3% to 6.6% depending on assumptions on the rates of asymptomatic infection. This is a downward-revised estimate from our previous modeling work. Facebook mobility data indicate that people started leaving their homes more regularly during the first week of May. Infections did not increase, which suggests people are following distancing and hygiene guidelines. We provide estimates of the mean duration of a medical-floor hospital stay (8.5 days), the mean duration on mechanical ventilation for surviving individuals (8.4 days), and the probability of progressing from medical-floor hospital care to critical care (15% for <40; 25% for >40). RIDOH data indicate that the 50-69 age group comprised a large share of the infections over the first month of the epidemic (through early April), but that this dropped as the epidemic progressed. One potential explanation to investigate is that the 50-69 age group was more compliant with stay-at-home and distancing recommendations
Background
Rhode Island’s successful lockdown in March led to declining case numbers from April 24 onward. In May, population movement began to gradually increase, but case numbers did not go up, suggesting that newly adopted hygiene and distancing measures were effective. We present an analysis with an updated mathematical model and improved inference methods. After additional literature review, we have revised downward our estimate of the number of asymptomatic infections, which revises downward our estimate of the number of Rhode Islanders infected during the course of the epidemic thus far.
Methods
A new model structure and some changes in parameterization were adopted for the inference conducted over the past month. Progression from hospitalization to ICU care now occurs early in the hospitalization period (or immediately). This change was made after further published evidence confirmed that the time from hospitalization to ICU admission was in general short. See summary of parameter estimates here.
A class diagram of the new model is shown on our methods page. The model now distinguishes between recoveries from non-hospitalized infection and hospital discharges. Likewise, deaths at home versus deaths in hospital are separated into different variables, making it possible to fit the model to state-level data that report at-home deaths and hospital discharges. Parameters for at-home death were added to the 60-69, 70-79, and 80+ age groups, although we do not yet have full confidence in the identifiability of these three age-specific death rates using current data.
The asymptomatic proportions in the model have changed. There is no way to parameterize these age-specific fractions using data collected by departments of health in US states, so they were originally set to be constant (or varying in a narrow range) based on the age-specific symptoms probabilities inferred in Wu et al (Nat Med). After assembling more literature in this area, we have decided to group our estimates of asymptomatic proportion into 20-year age bands. The asymptomatic proportions in our model are 83% (ages 0-19), 50% (20-39), 35% to 45% (40-59), 25% to 35% (60-79), and 20% (80+). Approximately half of all infections are asymptomatic with these parameter assumptions.
Data for the present analysis include case numbers through June 16. We also use data on deaths, hospitalization incidence, current hospitalization numbers, current ICU occupancy, and the number of ICU patients currently on ventilators.
Daily β-values (population mixing parameters) were modeled using cubic-spline basis functions as before. A negative binomial observation function with two reporting rates ρ1 and ρ2 was used to model the observation probability of daily symptomatic case counts; the first reporting rate corresponds to the first three weeks of March when test kits were scarce and patients were turned away from testing (including for not meeting CDC criteria of being a suspected case), and the second reporting rate corresponds to late March and the rest of the epidemic phase when most or all patients seeking a test could receive one.
Facebook mobility data were derived from mobile users with location tracking enabled. These were made available by the Covid-19 Mobility Data Network and they are presented here with a summary statistic describing the percentage of users that stayed home on a given day.
Results
Parameter Estimation
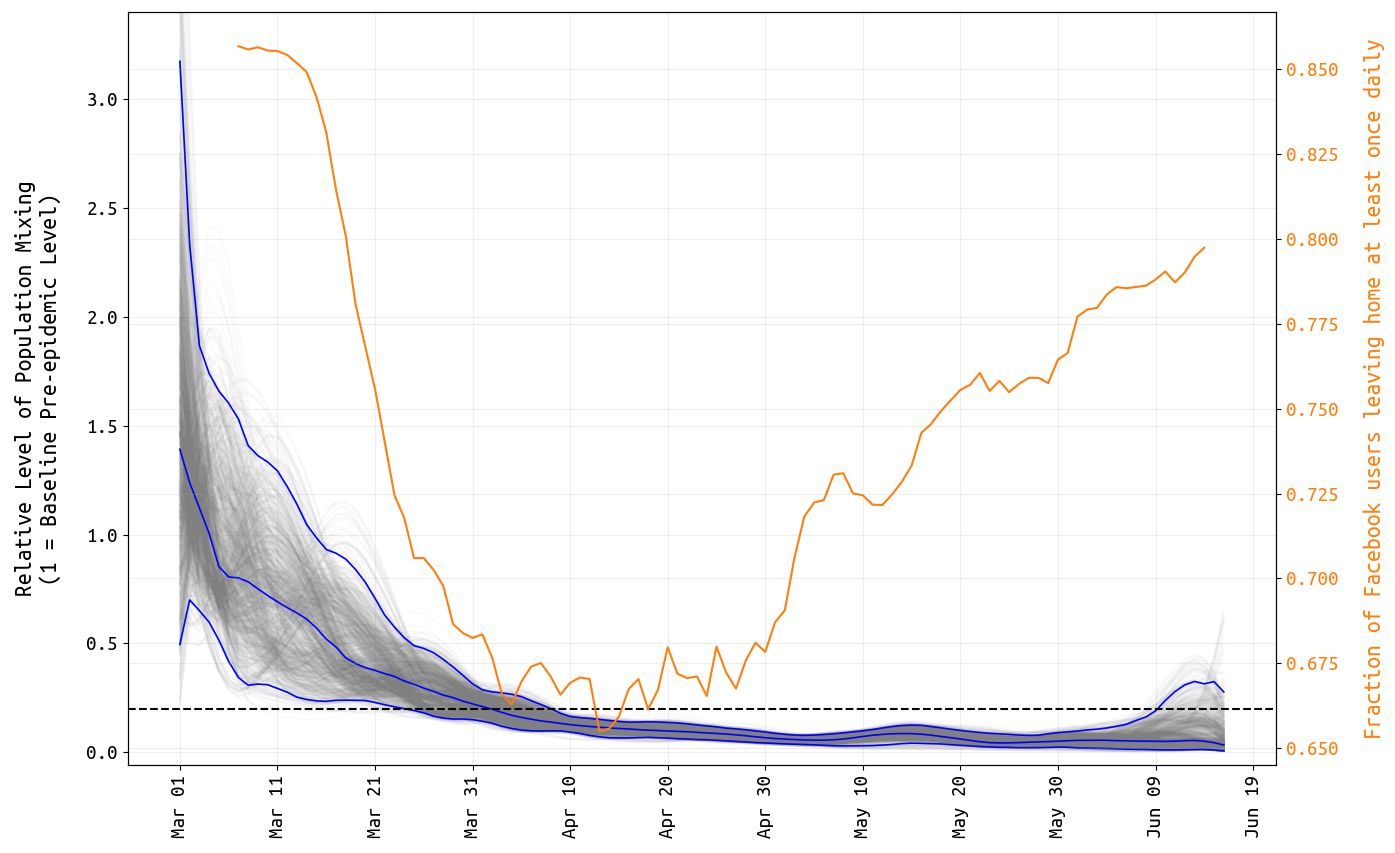
As in previous posts, posterior distributions for daily β-parameters were rescaled by the mean β-value between March 1 and March 10, representing the time period before any social distancting recommendations/requirements were put into place. Figure 1 shows the posterior distribution of all 108 relative mixing parameters from March 1 to June 16. As in our previous analyses, our inference on the population-level mixing parameters shows a marked drop from baseline (set at 1.0) to a mixing level that is >80% reduced from baseline levels for all of April and May. Note that the inference here cannot separate ‘number of human contacts’ from ‘infectiousness’. We assume that the observed drop in β is a result of lockdowns, school closures, and work-from-home policies; however as contact levels increased in early May (yellow line, Figure 1), the inferred β-parameters may have stayed low due to improved hygiene (resulting in lower infectiousness) and more cautious/distant mixing that would lower the infection probability per contact.
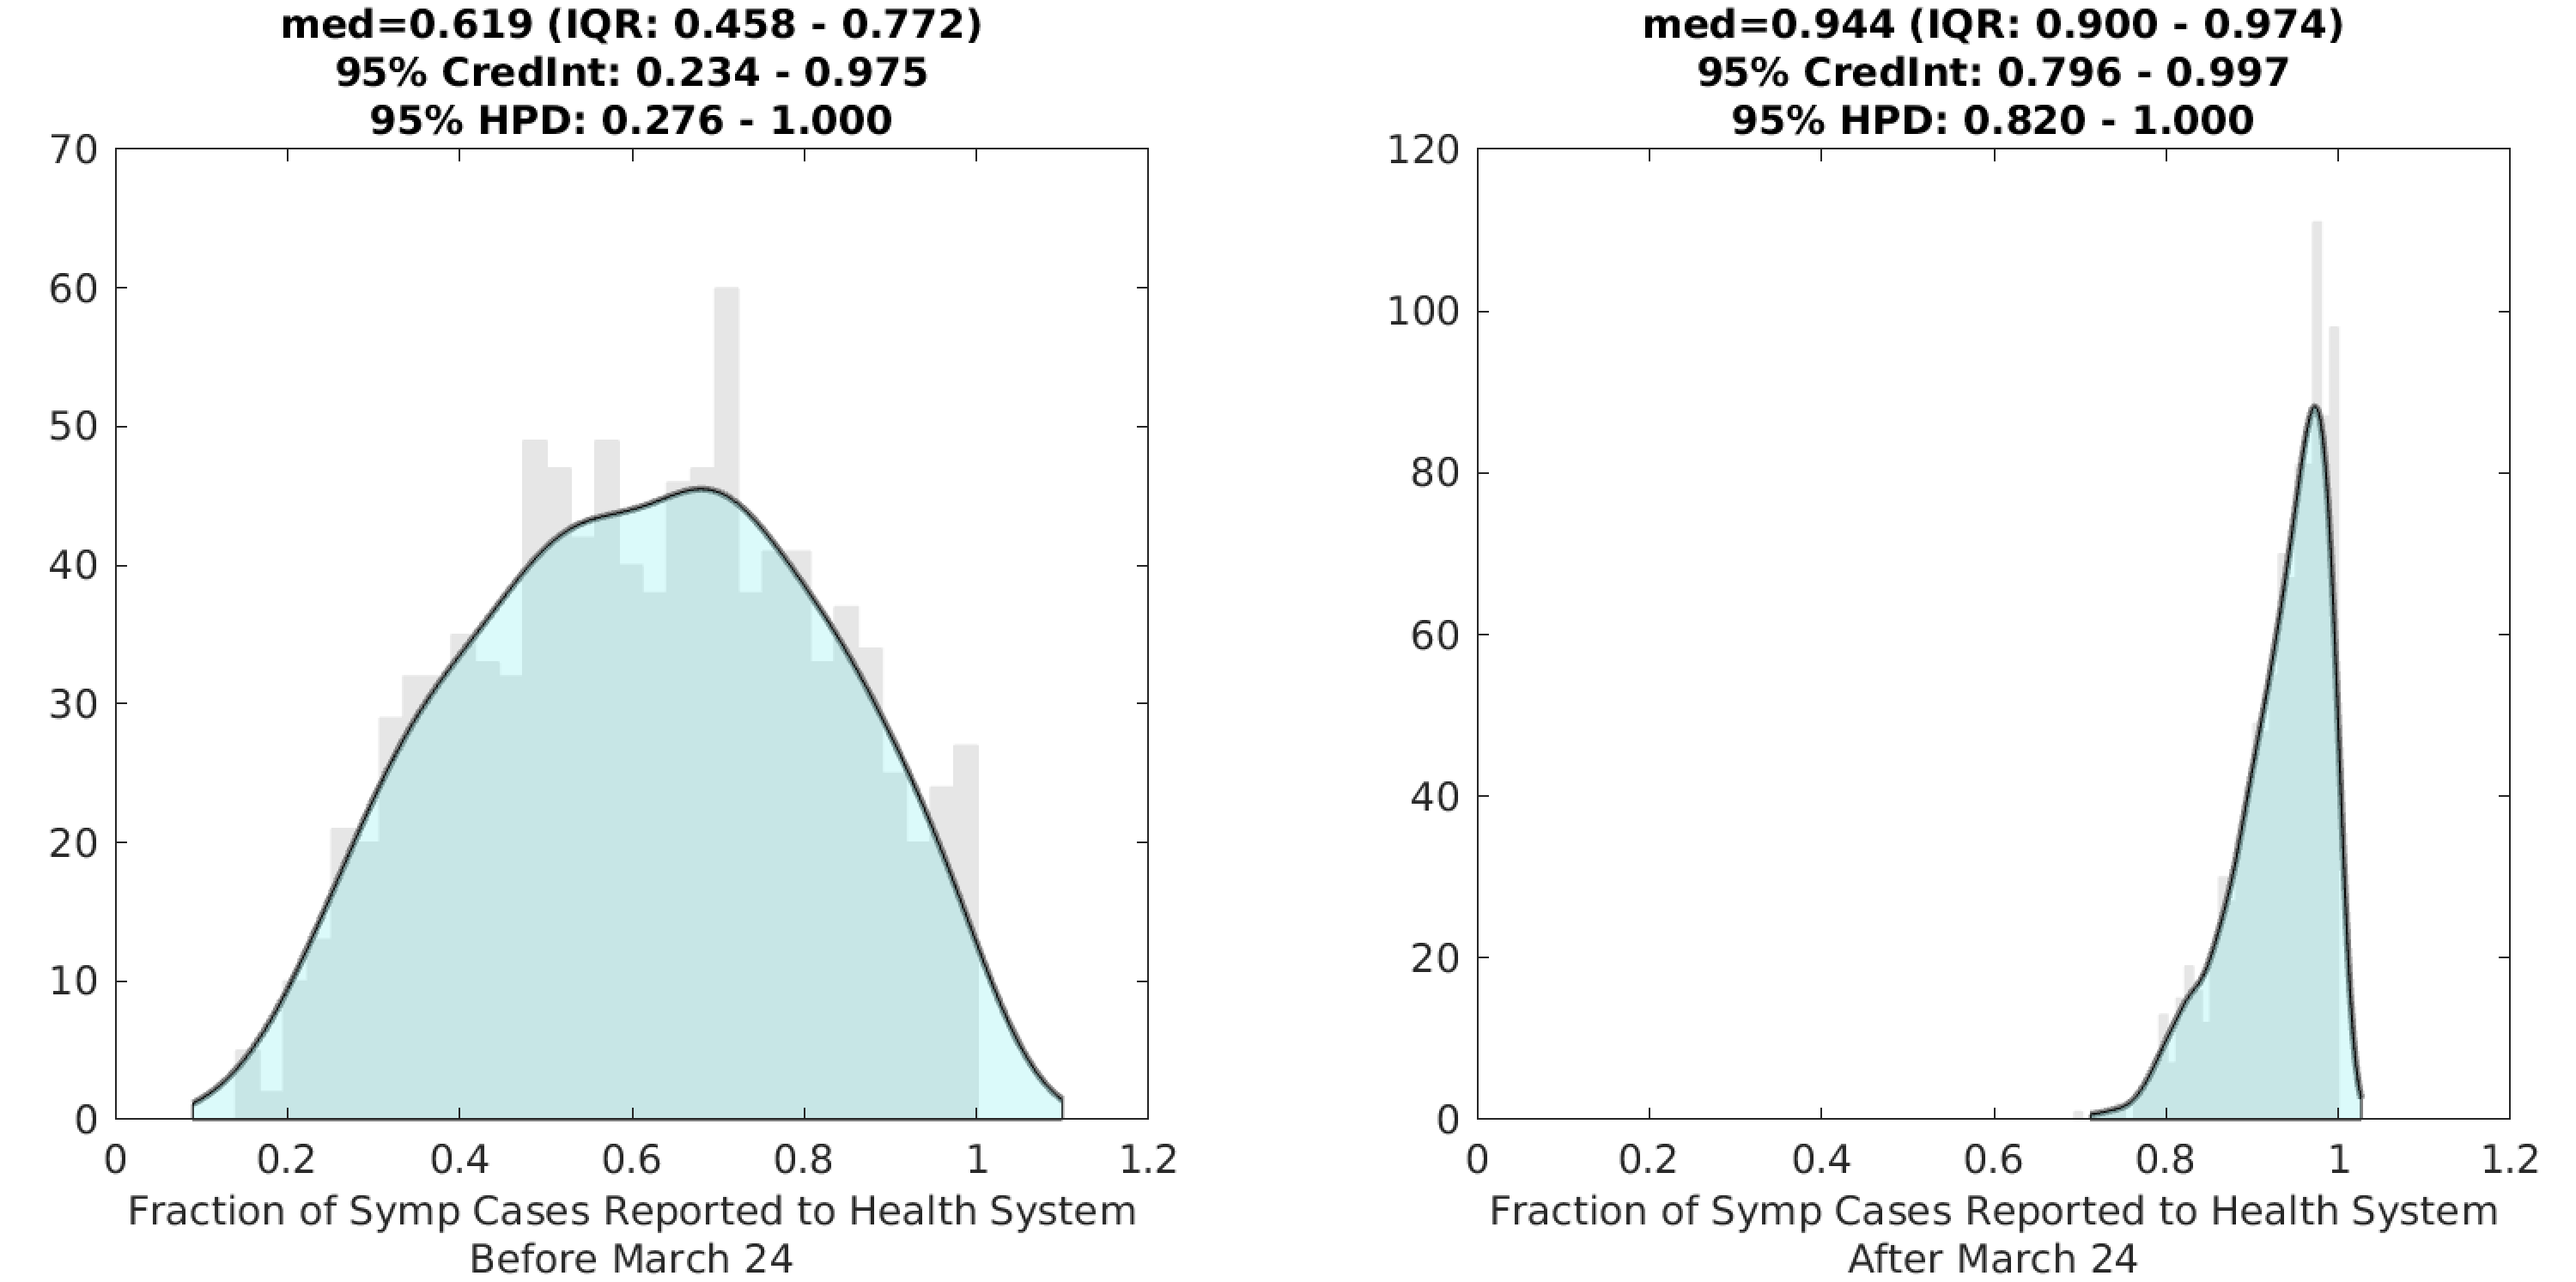
Through March 24, the health system was catching approximately 62% of positive COVID cases, with a high degree of uncertainty in this estimate. After March 24, 94% (95% HPD: 82% – 100%) of symptomatic cases were being observed and counted by the health system (Figure 2).

Figure 1. Posterior distribution for daily β-parameters that represent mixing and social/physical contact in the population. The blue lines show the posterior median and 95% credible region, and the light gray lines show individual mixing time series drawn from the posterior. The yellow line shows the fraction of Facebook users in Rhode Island that left home at least once per day.

Figure 2. Posterior distributions for the two reporting rates ρ1 (left) and ρ2 (right) in the model; the first reporting rate is meant to capture the period in early and mid-March when there was a testing shortage and strict guidelines for defining probable cases; a larger fraction of cases went unreported during this period. Gray bar graph in the background shows a histogram of 1000 samples from the posterior, and the filled green area is a kernel-smoothed density function. Medians, credible intervals, and HPD intervals are shown above each plot.
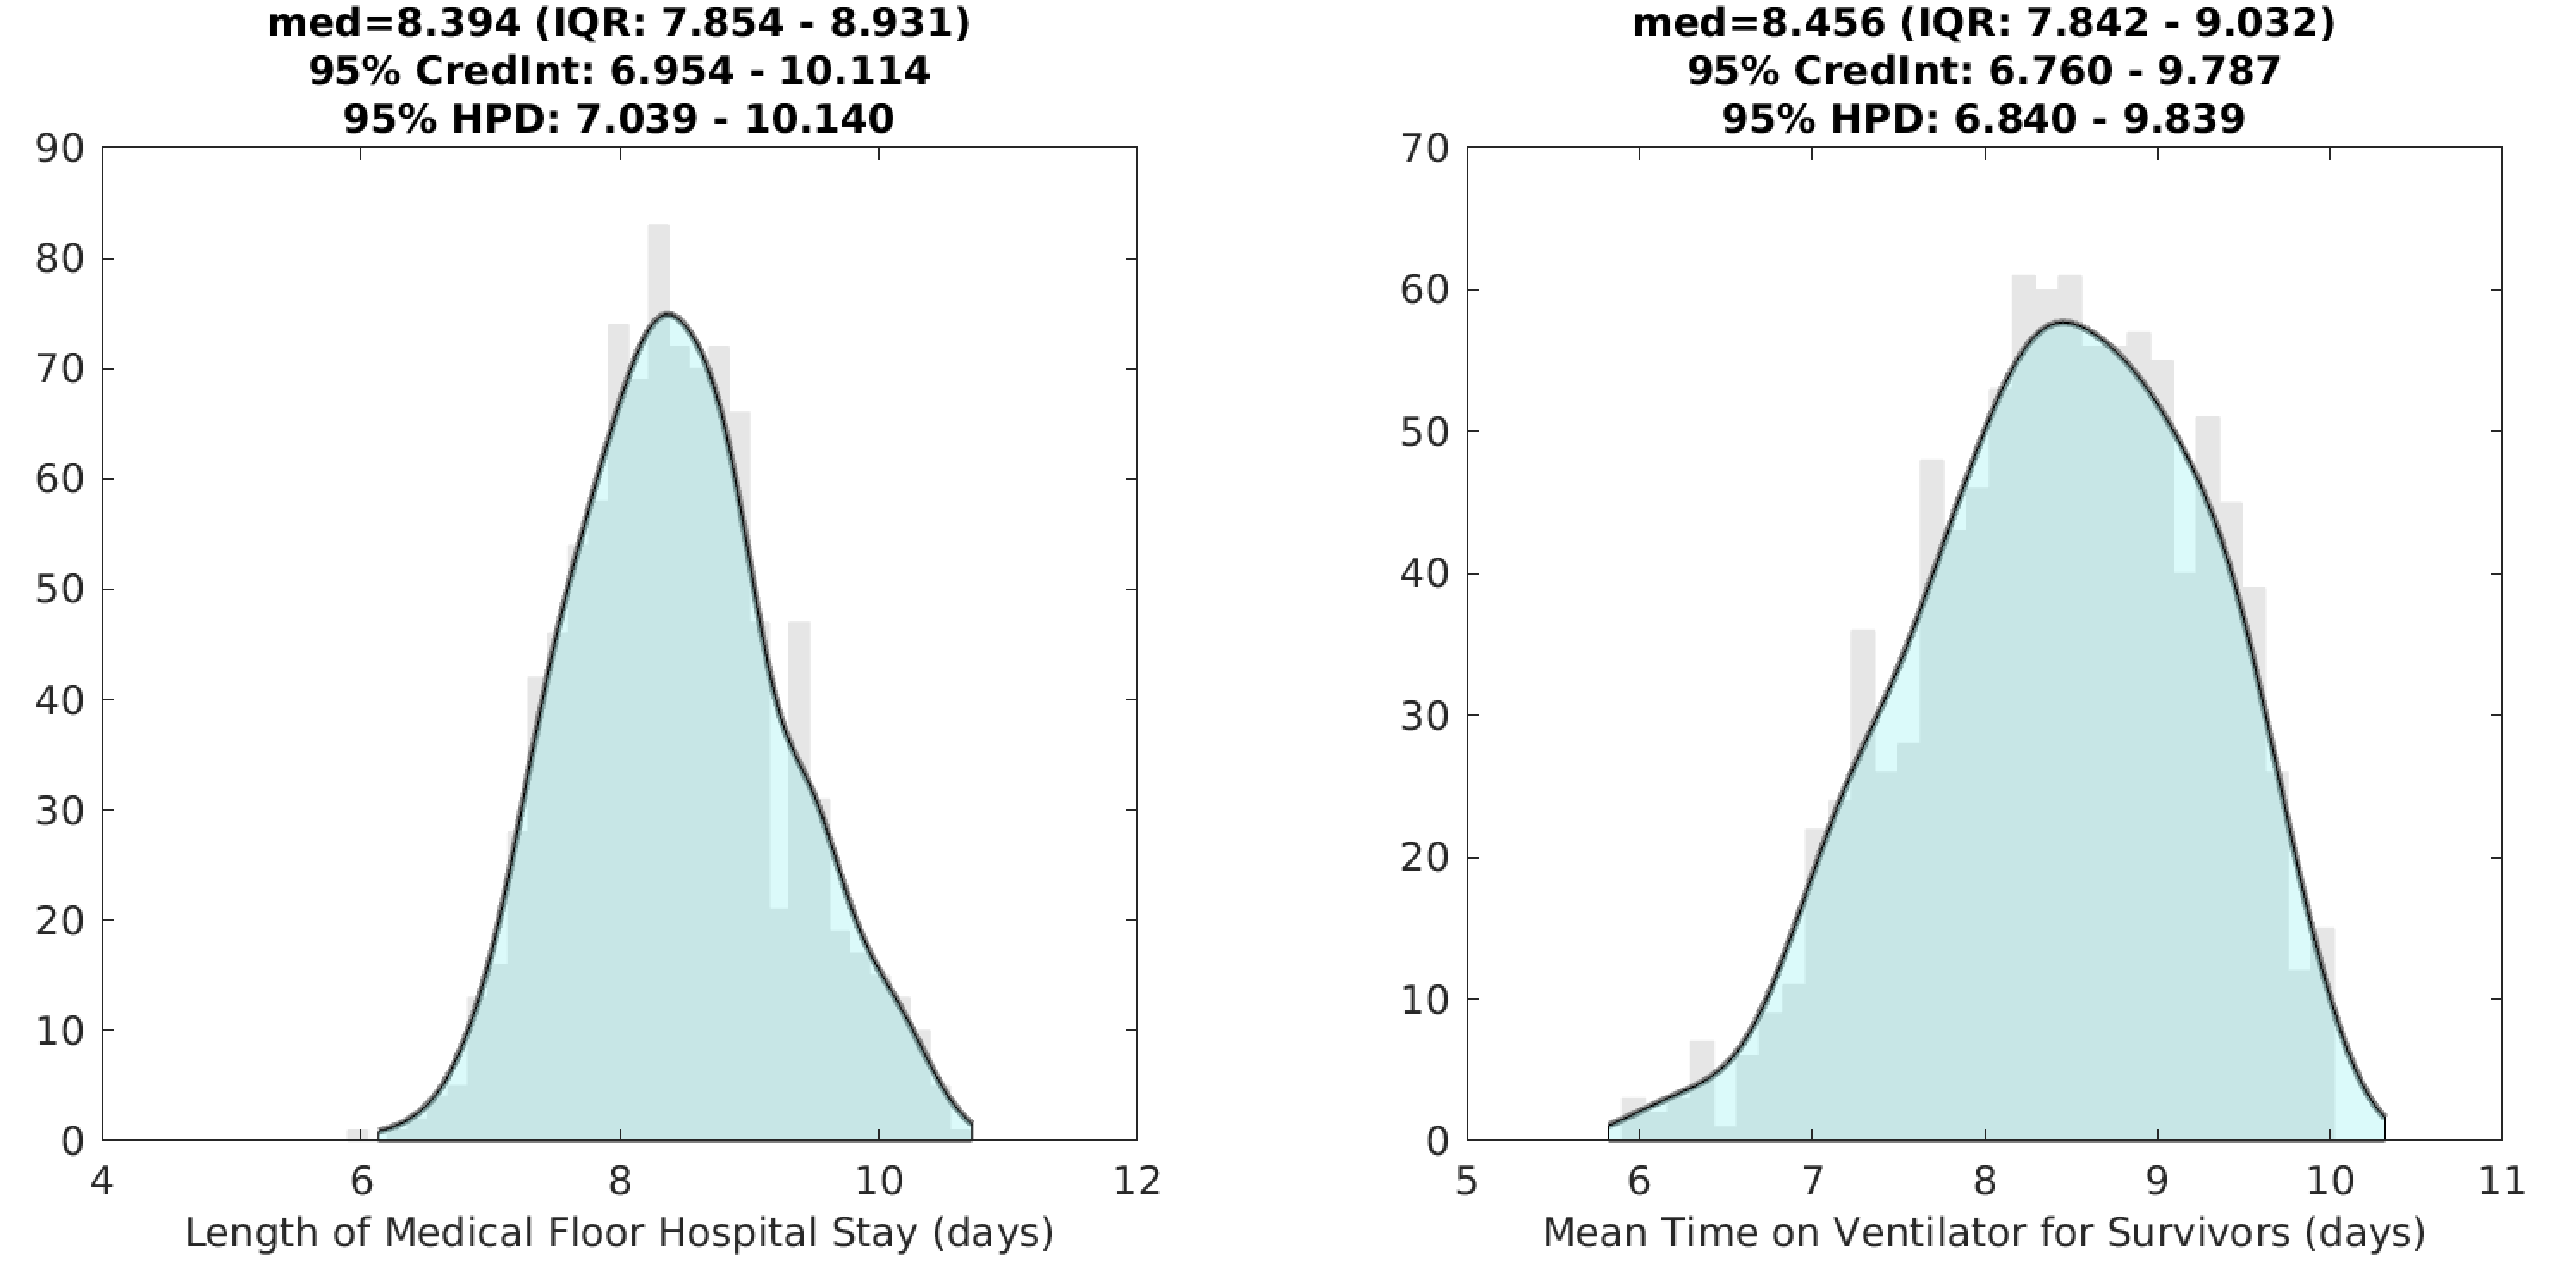
With our new model structure, inference on certain clinical parameters is more straightforward, although certain probabilities and durations pertaining to severe infection in younger age groups are still difficult to estimate due to low numbers of hospitalizations and deaths in these age groups. With >100 days of data on hospital admissions, hospital occupancy, and numbers of patients receiving mechanical ventilation, it is possible to estimate the mean duration of hospital stay as well as the mean time that a surviving patient receives mechanical ventilation. The mean medical-floor hospital stay is estimated at 8.4 days (95% HPD: 7.0-10.1), and the mean duration of mechanical ventilation is estimated at 8.5 days (95% HPD: 6.8-9.8); this latter estimate is for survivors only and the corresponding duration for patients who do not survive is 33% lower (this is a model assumption). It is not possible to estimate the duration of ICU-stay independently of duration on ventilator as a large fraction of ICU admissions require mechanical ventilation (>70%) and the typical time in the ICU without ventilation is just 1-2 days.

Figure 3. Posterior distributions for the mean duration of a medical-floor (i.e. non-ICU) hospital stay, and the mean duration of mechanical ventilation for survivors.
Probabilities of progression to ICU care are difficult to estimate per age group, but in general these probabilities have not varied much by age in published datasets from western countries; clinical data from China do show a clearer increase in probability of ICU admission by age. In Rhode Island, the probability of ICU admission (among hospitalized cases) is estimated to be around 15% for individuals under 40, and 25% for individuals over 40. As ICU admissions and ventilated patients are not reported by age, more precise estimates are not possible at this time.
An additional area of uncertainty is the age-specific death rate of ICU patients on ventilators. Published clinical results on ICU care indicate that survival for patients under 40 on mechanical ventilation is higher than 85%. These same data sets show that survival for patients over 70 is lower than 40% (with some estimates very low in the older age groups). The greatest uncertainty is in the 40-70 age range, as published results have varied widely on death probabilities in these age groups. Our preliminary estimate from Rhode Island data is that the survivorship of mechanically ventilated patients in the 40-70 age group is between 40% and 60%; there is substantial uncertainty in these estimates and we will be revisiting them in upcoming analyses.
Age-patterns of infection
The age profile of the epidemic changed in April. By early April, fewer than 2% of all reported cases were in children 0-19, but by mid-June this proportion had risen to just under 8%. The 50-69 age group represented about 37% of all infections in early April, but today they are just 27% of all cumulative confirmed COVID cases (Figure 4). The relative increase in cases in the younger age groups is consistent with the resumption of out-of-home activity (Facebook data, Figure 1) if the Facebook sample used for these metrics overlaps with the 0-19 age group. This association seems plausible for the 10-19 age group, but not for the 0-9 age group, particularly since schools remained closed during this period. Alternatively, the major behavioral changes may have come from the 50-69 age group, who may have have complied more fully with stay-at-home recommendations, thus reducing their relative share of infections in April and May. This is plausible as these age groups are more susceptible to severe infection, and good public health communication in Rhode Island would have made them aware of these risks. However, we have no independent evidence to suggest that compliace with stay-at-home recommendations or social distancing guidelines was higher in this age group.

Figure 4. Y-axis shows the proportion of all cumulative reported COVID cases in each 10-year age band. Data are taken from Rhode Island Department of Health data dashboard, with no additional inference, modeling, or processing.
Evaluation of April-May lockdown
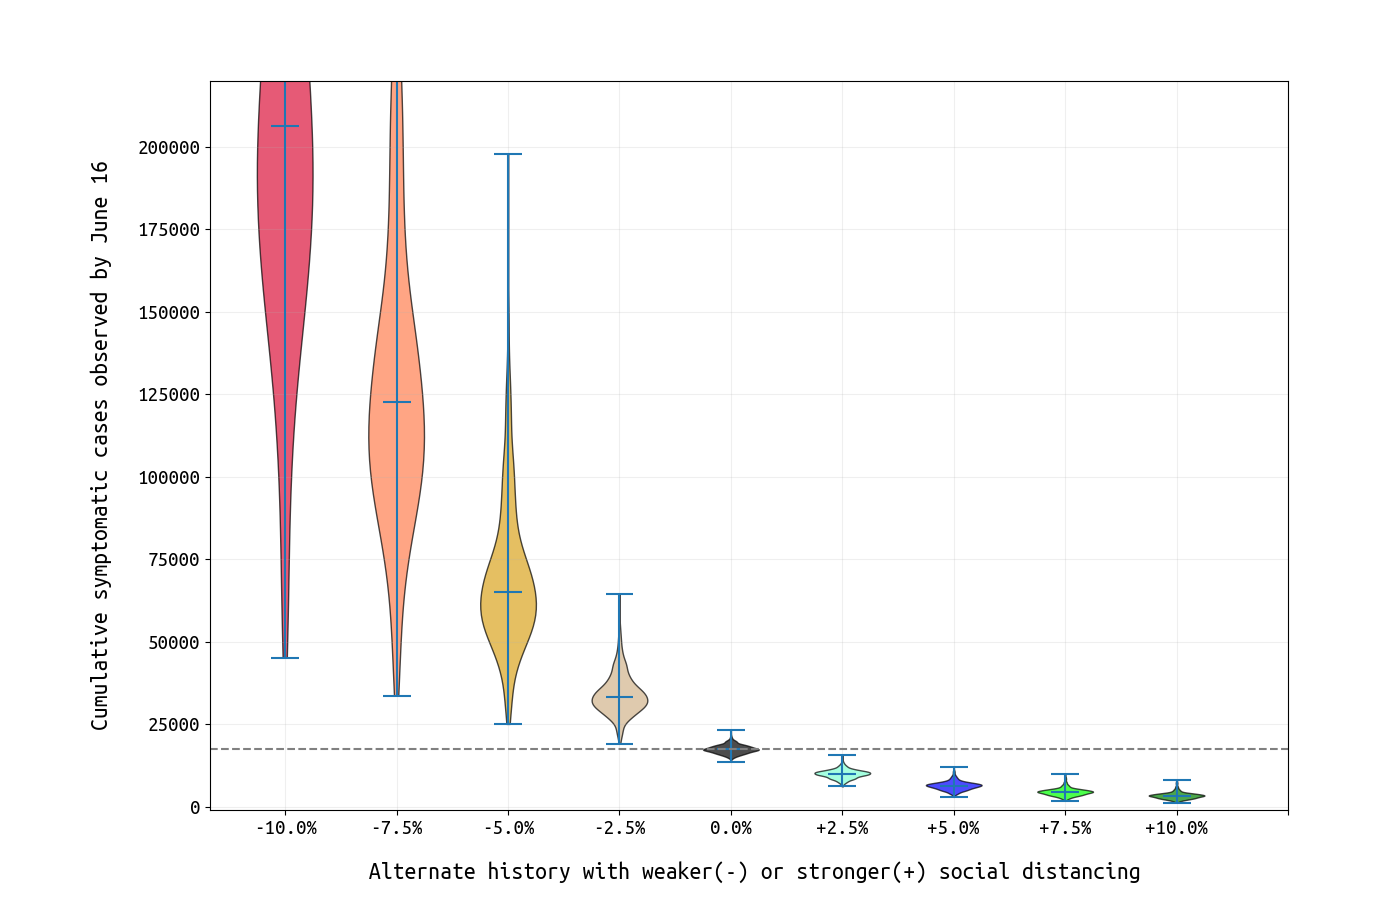
Finally, we present an evaluation of the lockdown period and whether the strict measures were necessary. Using the inferred β-values from Figure 1, we generate alternative scenarios where the β-reductions from baseline were greater (stricter lockdown) or smaller (less strict lockdown) than what was observed over the past three months (Figure 5). The changes from observed to weaker lockdown appear dramatic, and this is expected since we are reducing the growth rate of an exponential process; on a log-scale the changes appear linear. The crucial limitation in our model here is that we assume mean-field mixing in the population and do not take into account that certain groups (residents of elderly care facilities, health-care workers, essential employees that cannot work from home) cannot reduce their exposure to the same degree as schoolchildren (with schools cancelled) or individuals that can comfortably work from home for several months. Taking this into account, we see that the epidemic may move as two partially-connected processes: one in eldelry care homes and health-care providers, and a second in the general population who would get infected at home, work, and various public places. A model-fit including population heterogeneity in susceptibiility to infection (including, at a minumum, separate categories for these two groups) would be needed to more accurately determine whether a 10% less strict lockdown period would have resulted in dramatically different infection numbers.

Figure 5. Each violin plot shows the posterior number of symptomatic cases by June 16 under alternative scenarios where social distancing was more strict (rightward on x-axis) or less strict (leftward) than what was observed.
Conclusions and Limitations
With an estimated 17,412 symptomatic cases by June 16 (95% CI: 15169-20196) and an assumption that about half of cases are asymptomatic (this is the ODE model’s assumption currently), we approximate a total number of 35,000 infections having occurred by June 16 (3.3% of the population). If the asymptomatic fraction is as high as 0.75, the total number of infections could be as high 70,000 (6.6% of the population).
For states like Rhode Island that entered successful lockdown periods and did not see a rebound in case numbers in May or June, the major challenge is that the population at present has very little immunity. Rhode Island recorded 8500 confirmed COVID cases in April, 6000 cases in May, and 1200 in the first two weeks of June. If these low numbers can be maintained for the entire summer, this will allow time for the additional preparation necessary when school sessions in the fall initiate larger outbreaks and epidemic waves.
In all states, heterogeneity in susceptibility needs to be included in modeling analyses so that chains of infection in health-care settings, elderly-care settings, and other vulnerable populations can be modeled separately from the general population.
Updates and Corrections
No updates or corrections at this time.