October 7 2020
Attack Rate Analysis
Summary
The graphs below show the SARS-CoV-2 attack rates in Rhode Island, Massachusetts, and Pennsylvania through September 15 2020. The attack rate is defined as the total percentage of the population infected, and it is a ‘month-early’ version of the seroprevalence time series. The analysis is based on data through Sep 21, so a patient presenting with symptoms on Sep 21 is included and counted as having been infected on Sep 15 (mean incubation period is six days). The central blue lines show the median attack rate, while the outer blue lines demark the 95% credible interval of attack rates, based on 1000 draws from the joint posterior distribution of all parameters inferred. The gray lines in the background show all 1000 trajectories. The median attack rate (and 95% CI) is shown for the end of each month in the plot. In the Bayesian inference analysis, we used case, hospitalization, and death time series, and the age-specific asymptomatic fractions in the Davies et al paper.
Attack Rates through September 15
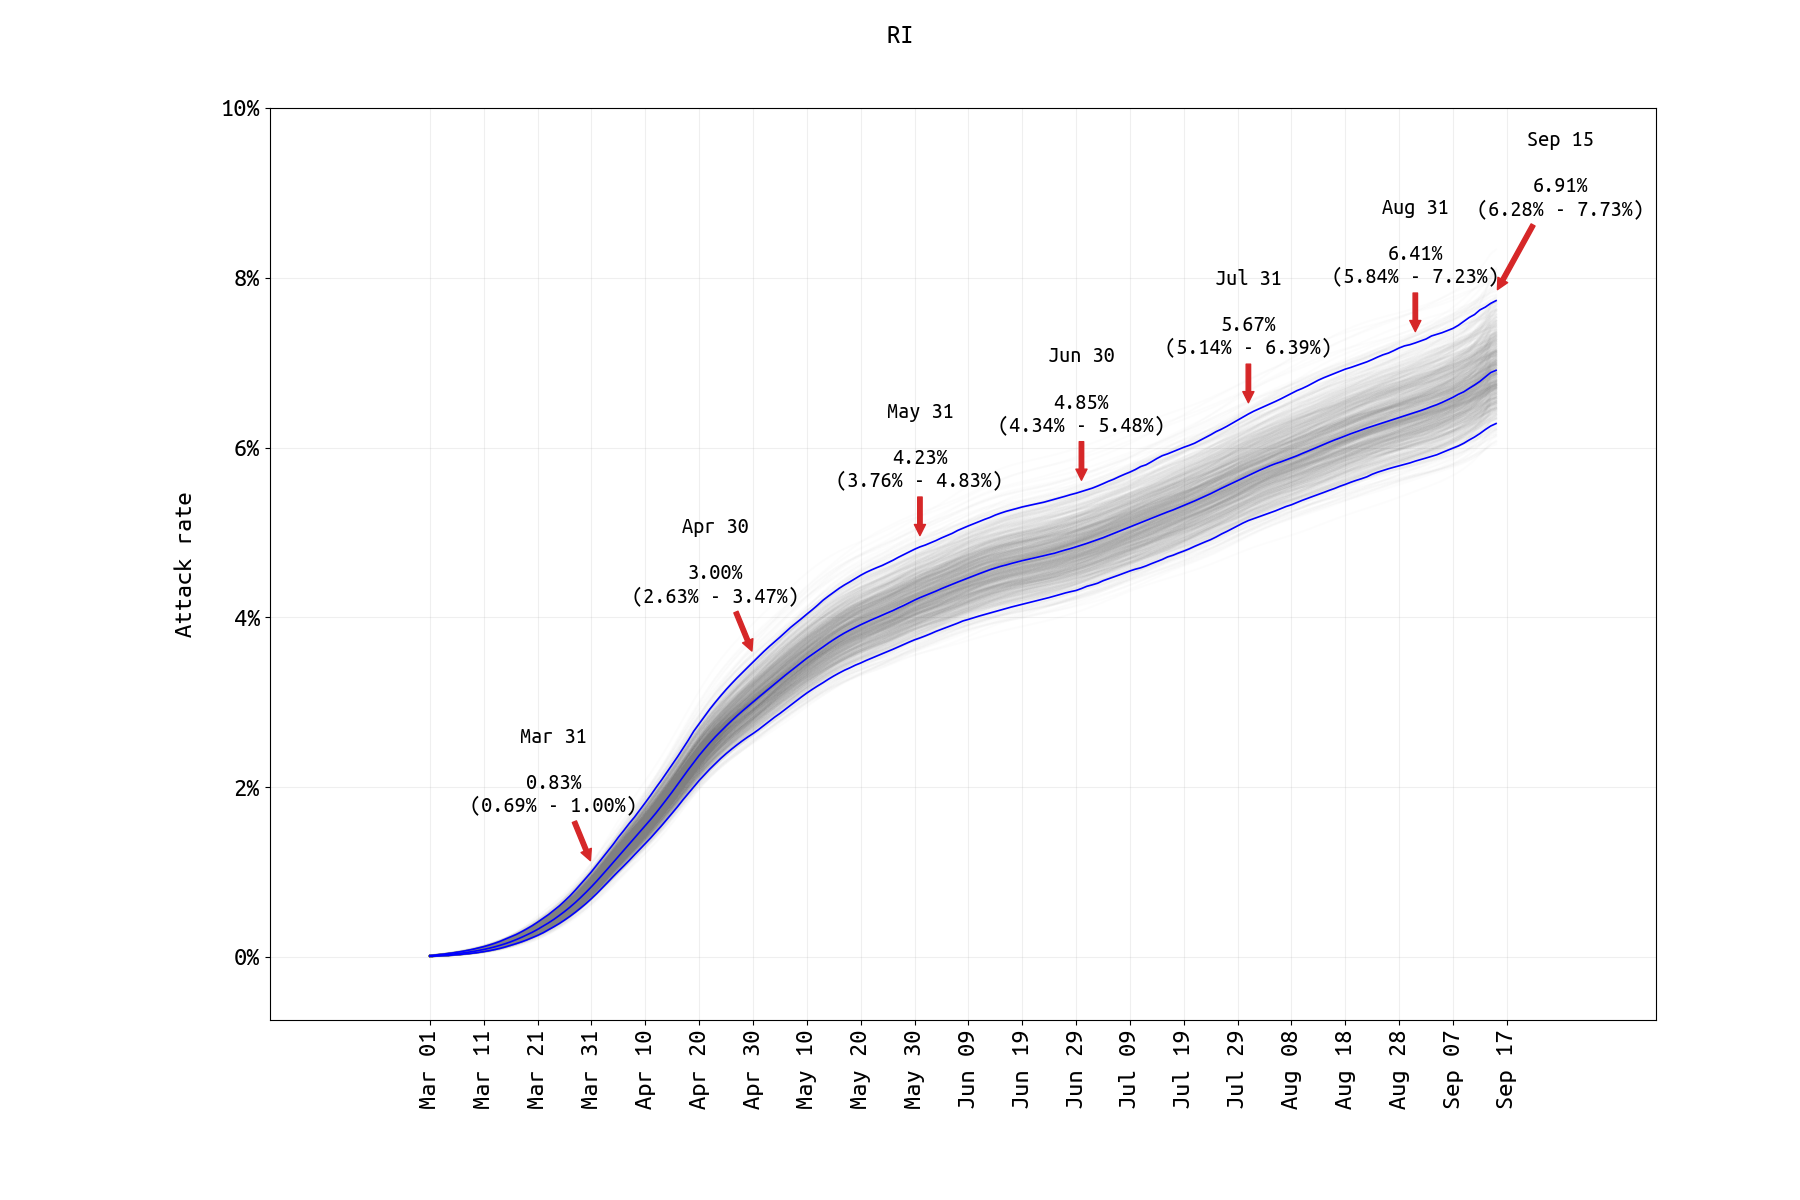
Figure 1. SARS-CoV-2 attack rate in Rhode Island from March 1 2020 to Sep 15 2020. No prior-distribution constraint was used in matching final case numbers between the model and the data. The infection fatality rate (IFR) estimate from the RI data thus far is 2.34% (95% CredInt: 1.98% — 2.76%) which is much higher than previously reported IFR estimates. The probable reason is that the IFR is primarily determined by the death rate in the higher age brackets (70-79, 80+), and we believe it may be biased upwards in this analysis as the >70 population in Rhode Island affected by the pandemic thus far was the most vulnerable subgroup in this age range. This is the same effect as was seen in our July 31 analysis. The age-specific IFR for the 70-79 age group (~11%) and the 80+ age group (~20%) were measured higher than in other studies, and this may be the cause of the high estimate of the general population IFR. Model assumes that age-specific mixing rates changed in May 2020 and that the rate of ICU admission dropped in May/June 2020 (both supported by lower DIC).
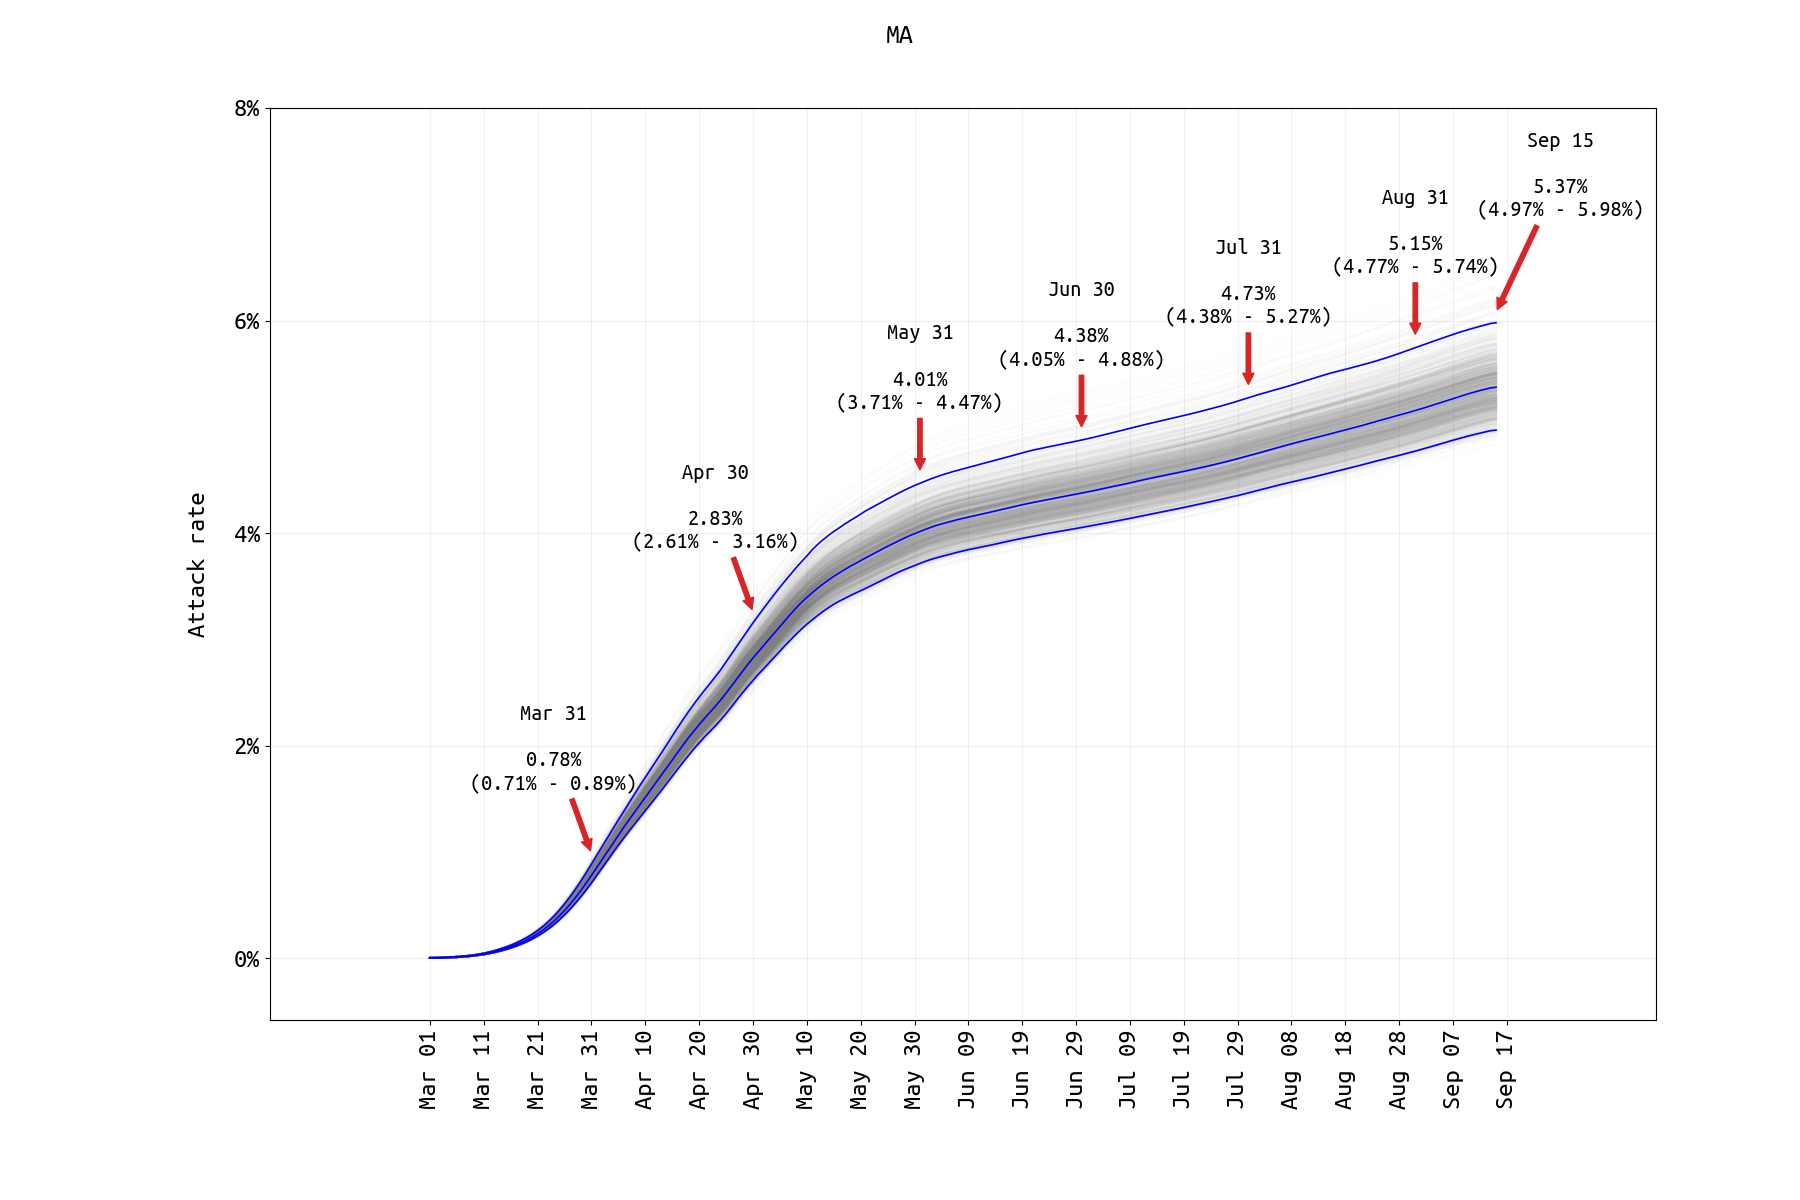
Figure 2. SARS-CoV-2 attack rate in Massachusetts from March 1 2020 to Sep 15 2020. Since our previous post, the cumulative hospitalization data have been removed from the Massachusetts analysis (as these data on the MassDPH website represent a subgroup of a followed cohort, and not all reported hospitalizations from a group of hospitals). The reporting rate is estimated by ensuring that the symptomatic case data and the ‘current hospitalizations’ data streams are both fit well, however this fitting requires that we know the duration of a typical medical-floor level hospital stay. The median estimate of a medical-floor hospital stay in this analysis is about 17 days which may be accurate for Massachusetts, but we have no corroborated this. A prior-distribution constraint was used in matching final case numbers between the model and the data. Model assumes that age-specific mixing rates changed on April 29 (estimated) and that the rate of ICU admission dropped in May/June 2020 (both supported by lower DIC).
When a cumulative hospitalization time series becomes available, the inference should be re-done with this new data stream. Currently, this time series is not available from the MassDPH raw data dashbaord files. The current MA attack rate estimate is substantially lower that the estimate obtained with the July 31 data. Until a cumulative hospitalization time series becomes available, this estimate should be treated as preliminary.
A recent Lancet paper reports seroprevalence in the MA dialysis population at around 11.3% in June/July, which is more than twice as high as our estimate for the same time period. However, this 11.3% estimate is not corrected for race/ethnicity, vulnerability of the dialysis patient group, or the lack of 0-18yo in the analysis. It is possible that the June 30 attack rate in MA was twice as high in an >18 vulnerable sub-population than it was in the general population as a whole.
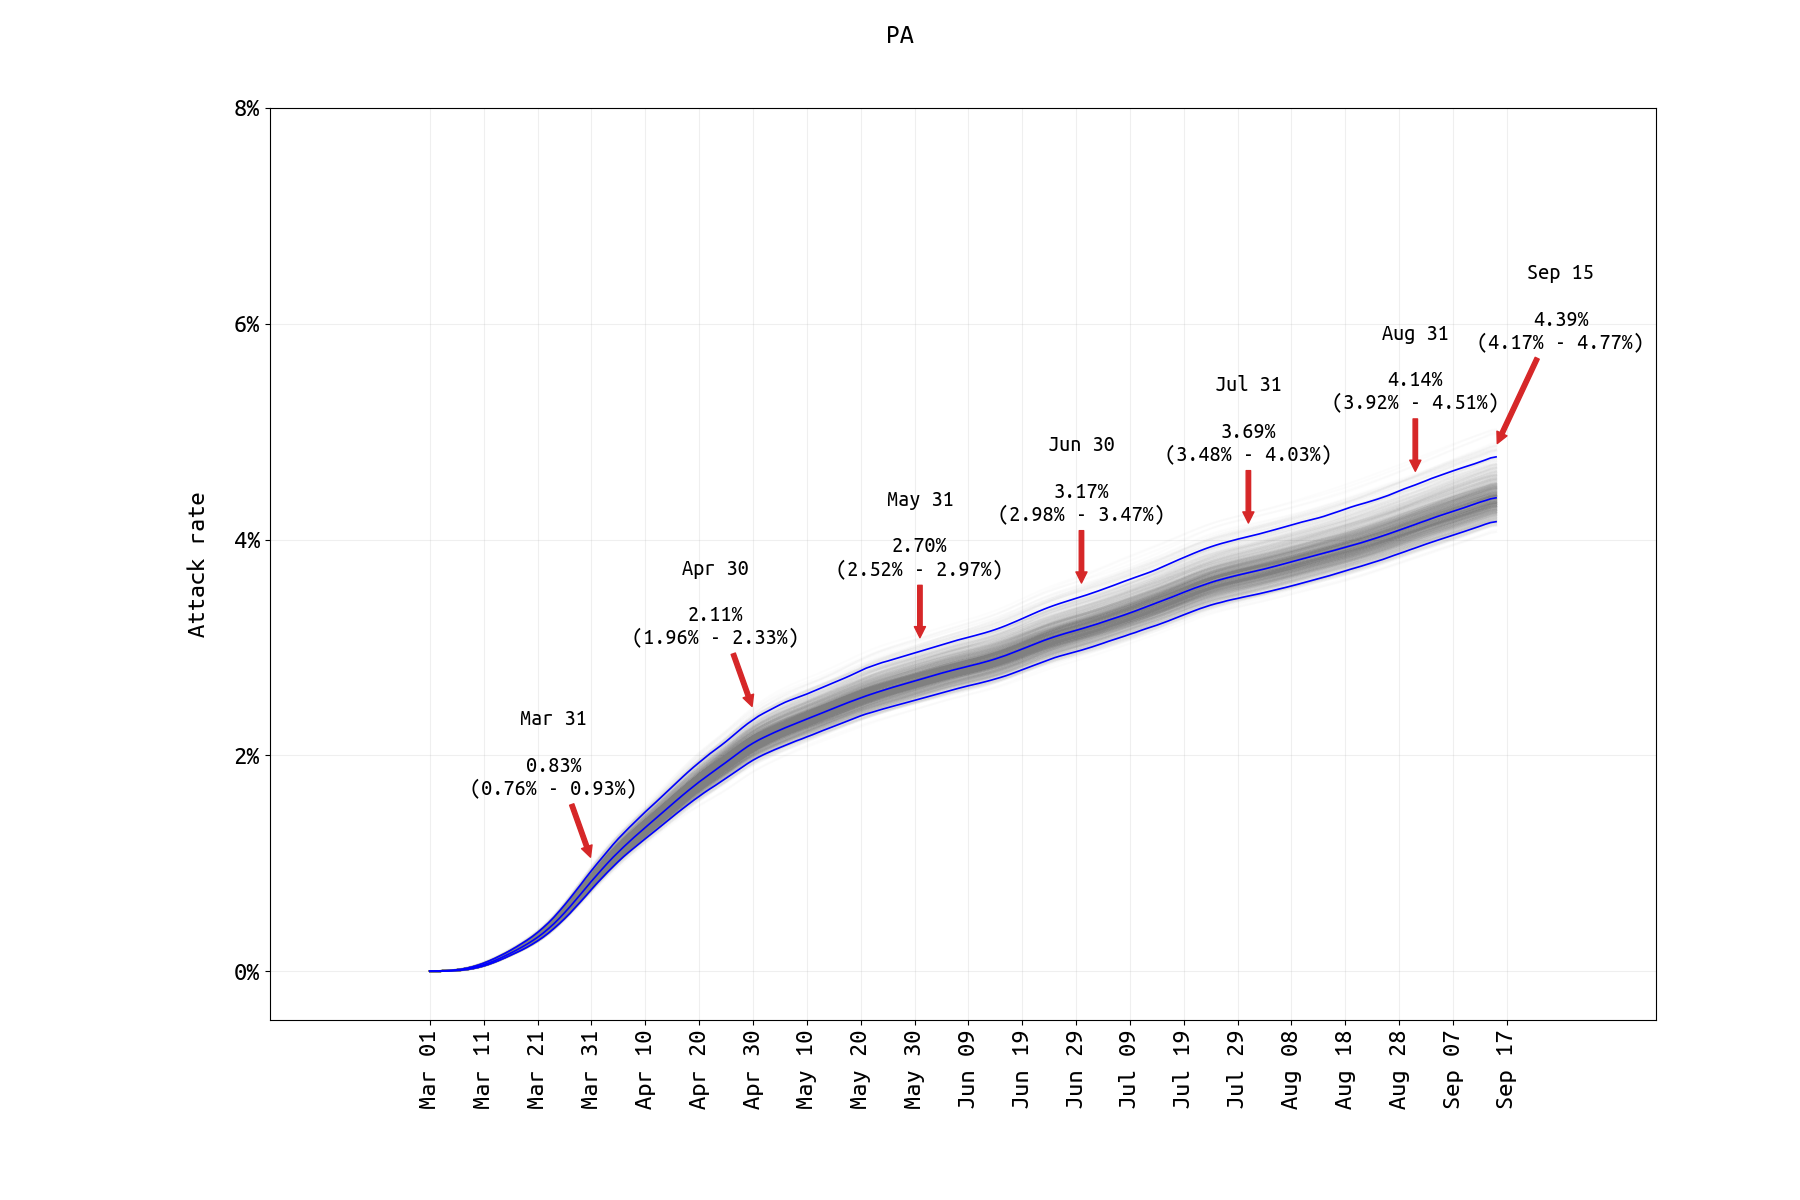
Figure 3. SARS-CoV-2 attack rate in Pennsylvania from March 1 2020 to Sep 15 2020. A prior-distribution constraint was used to ensure that Sep 15 case numbers and model output were within 10% of each other. Hospitalization fits were difficult for PA data as new hospitalization data are only available through the second half of May and ICU counts are not available. Model assumes that age-specific mixing rates changed in May 2020 and that the rate of ICU admission dropped in May/June 2020 (both supported by lower DIC). Attack rate estimates for PA are similar to those obtained analyzing data through July 31.
A recent Lancet paper reports seroprevalence in the PA dialysis population at around 6.4% in June/July, which is more than twice as high as our estimate for the same time period. As noted above, this 6.4% is not corrected for race/ethnicity, vulnerability of the dialysis patient group, or the lack of 0-18yo in the analysis. It is possible that the June 30 attack rate in PA was twice as high in an >18 vulnerable sub-population than it was in the general population as a whole.