August 13 2020
Attack Rate Analysis
Summary
The graphs below show the SARS-CoV-2 attack rates in Rhode Island, Massachusetts, and Pennsylvania through July 31 2020. The attack rate is defined as the total percentage of the population infected, and it is a ‘month-early’ version of the seroprevalence time series. The central blue lines shows the median attack rate, while the outer blue lines demark the 95% credible interval of attack rates, based on 1000 draws from the joint posterior distribution of all parameters inferred. The gray lines in the background show all 1000 trajectories. The median attack rate (and 95% CI) is shown for the end of each month in the plot. In the Bayesian inference analysis, we used case, hospitalization, and death time series, and the age-specific asymptomatic fractions in the Davies et al paper.
Attack Rates through July 31
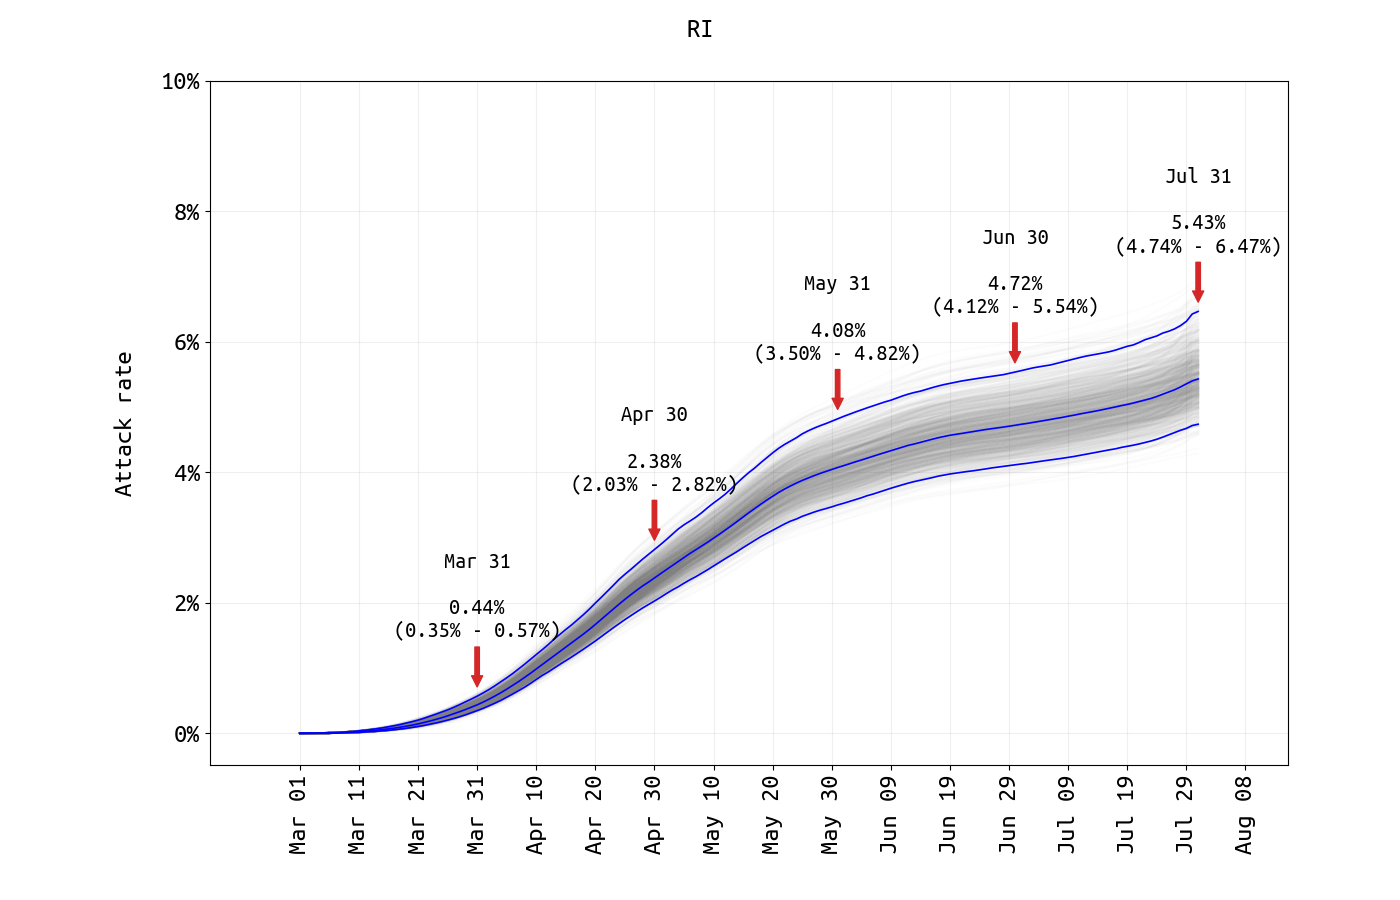
Figure 1. SARS-CoV-2 attack rate in Rhode Island from March 1 2020 to July 31 2020. No prior-distribution constraint was used in matching final case numbers between the model and the data. The infection fatality rate (IFR) estimate from the RI data thus far is 2.39% (95% CredInt: 1.92% — 2.85%) which is much higher than previously reported IFR estimates. The reason is that the IFR is primarily determined by the death rate in the higher age brackets (70-79, 80+), and we believe it may be biased upwards in this analysis as the >70 population in Rhode Island affected by the pandemic thus far was the most vulnerable subgroup in this age range. The age-specific IFR for the 70-79 age group (~12%) and the 80+ age group (~19%) were measured higher than in other studies, and this may be the cause of the high estimate of the general population IFR.
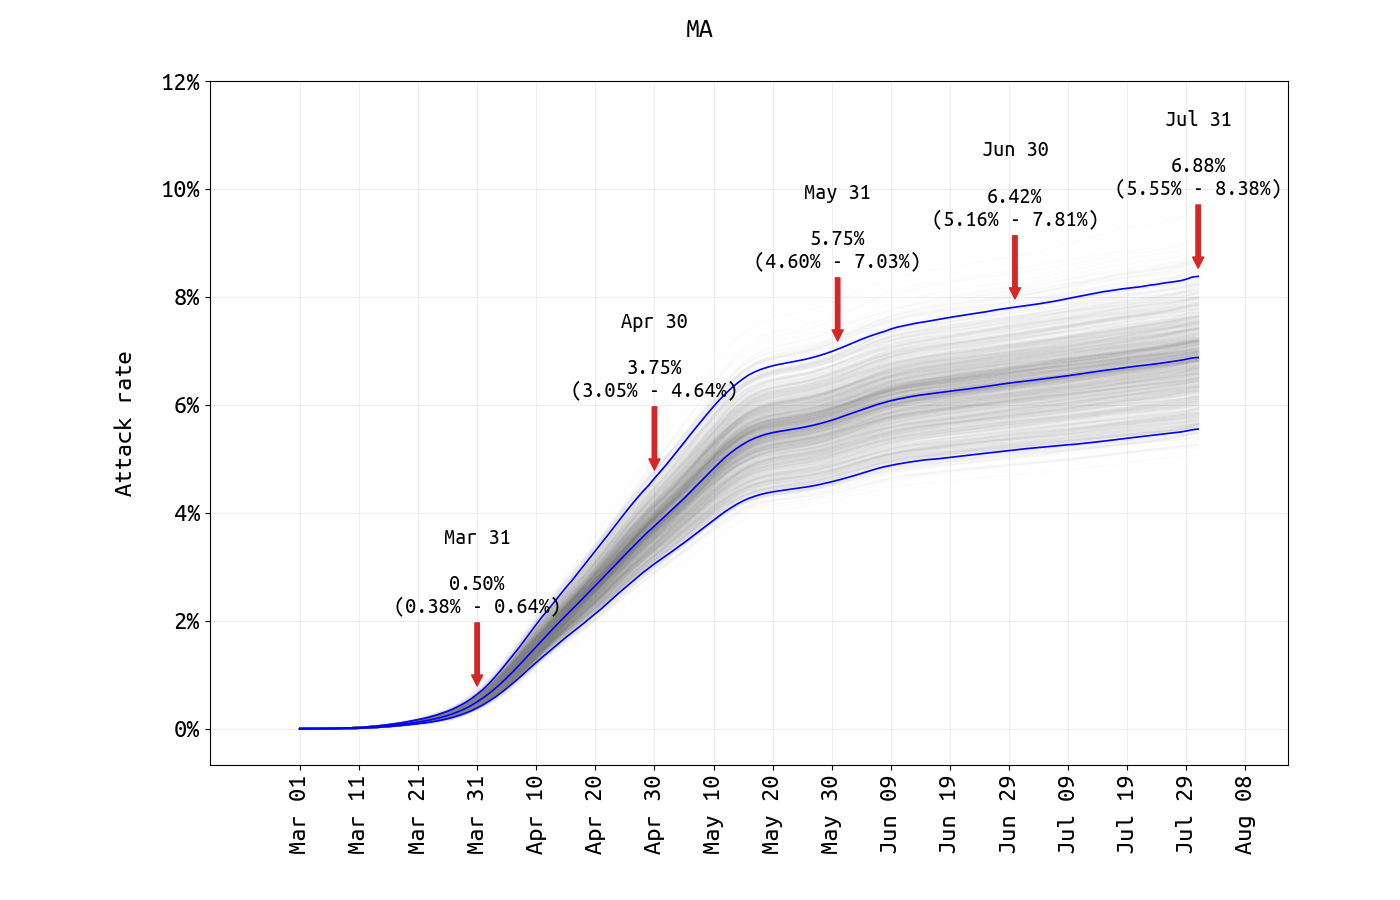
Figure 2. SARS-CoV-2 attack rate in Massachusetts from March 1 2020 to July 31 2020. No prior-distribution constraint was used in matching final case numbers between the model and the data. Due to challenges in estimating the hospital reporting rate in Massachusetts (only a fraction of new daily hospitalizations are reported to MassDPH in the daily data updates), we are not currently reporting an IFR for Massachusetts data.
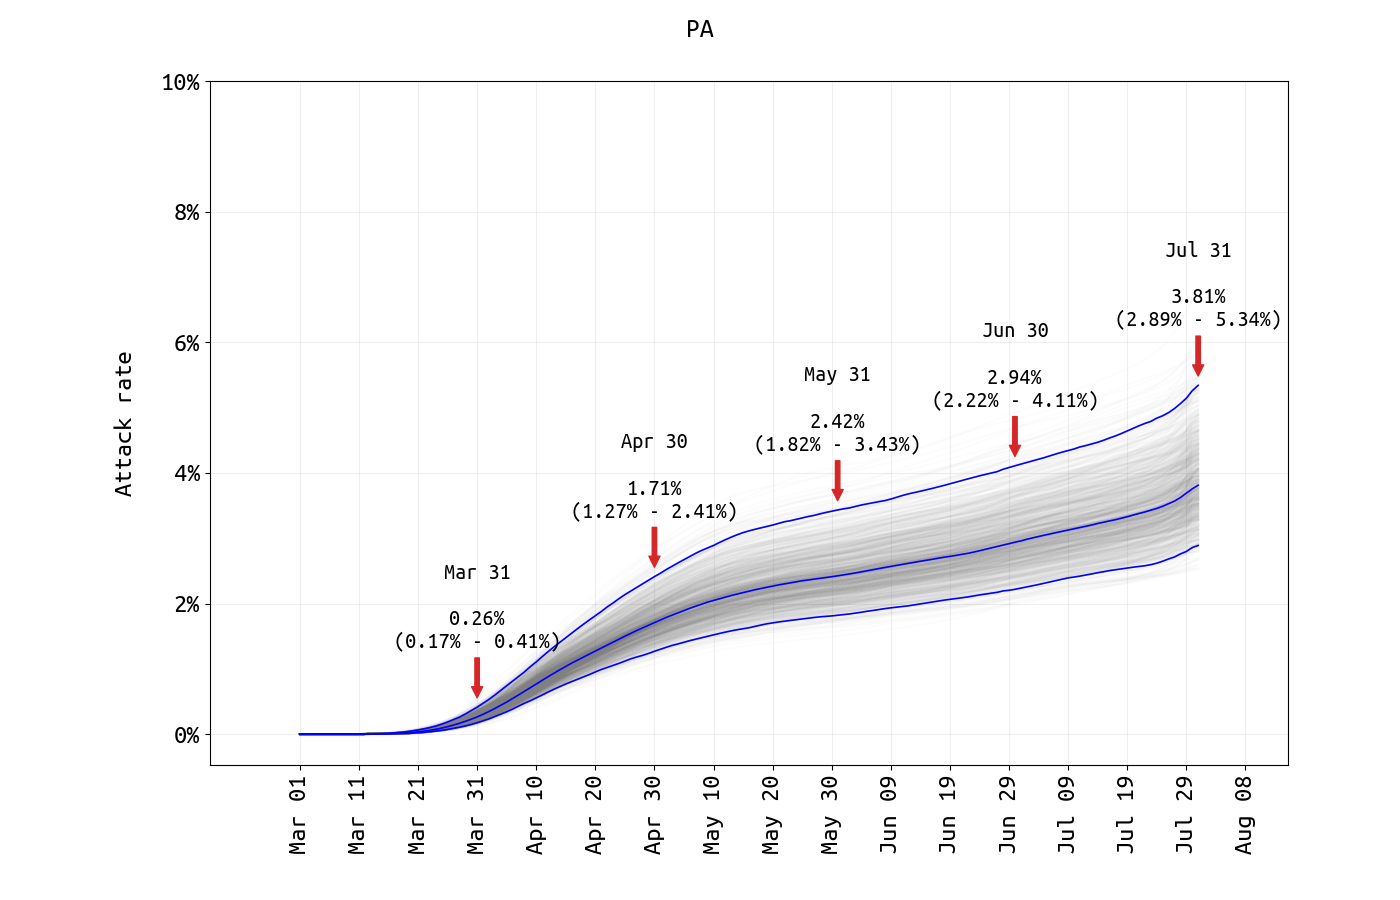
Figure 3. SARS-CoV-2 attack rate in Pennsylvania from March 1 2020 to July 31 2020. A prior-distribution constraint was used to ensure that July 31 case numbers were within 10% of each other when comparing model to data. Hospitalization fits were difficult for PA data as new hospitalization data are only available through the second half of May and ICU counts are not available. The estimates above are still potentially underestimates by 10%, or perhaps more, due to poor model fit for some data types. The safe conclusion from the above graph is that the SARS-CoV-2 attack rate in Pennsylvania through July 31 is below 6%.