July 18 2020
Preliminary Analysis
Summary
The March-April lockdown in Pennsylvania reduced transmission-capable mixing in the population by more than 80% and helped bend the epidemic curve downward to where PA was reporting 300-500 new cases per day, down from a peak of ~2000 on April 9. We estimate that 38.7% (95% HPD:25.9%-55.5%) of symptomatic cases are reported to Pennsylvania’s health system, putting the underreporting factor (for total infections) of PA between 4 and 7. By July 7, between 3.3% and 4.9% of Pennsylvania’s population had been infected with SARS-CoV-2, depending on the assumption made on rates of asymptomatic infection. Uncertainty bounds on attack rate estimates range from 2.3% to 6.4%. The infection fatality rate is difficult to estimate at the moment; our current IFR-estimates, which will continue to be refined, are just above 1%.
Background
To date, Pennsylvania has reported more than 94,000 total cases of COVID-19 and more than 6800 deaths. The lockdown period in late March and April reduced infection rates and case numbers substantially, and Pennsylvania appears to have re-opened in May and June with little impact on total case numbers. However, in early July case numbers started to increase again. Here, we analyze Pennsylvania case data through July 7 2020, and we provide statistical estimates for population-mixing reductions, the completeness of the surveillance system, and the population attack rate through July 7.
Methods
As in our earlier posts analyzing data from Rhode Island and Massachusetts, we use an ordinary differential-equations (ODE) system to model the spread of SARS-CoV-2 in Pennsylvania, and we fit the model to nine clinical data streams available from the Pennsylvania Department of Health website. The data streams are (1) cumulative confirmed cases, (2) cumulative confirmed cases by age, imputed if missing, (3) cumulative hospitalized cases, (4) cumulative hospitalized cases by age, imputed if missing, (5) number of patients currently hospitalized, (6) number of patients currently undergoing mechanical ventilation, (7) cumulative deaths, (8) cumulative deaths by age, imputed if missing (9) cumulative hospital deaths. Data were obtained through the Pennsylvania Department of Health Update Archive with age-structured data pulled from the PA DOH arcgis dashboard.
The ODE model is described on our methods page and a summary of currently used parameter estimates is shown here.
A likelihood function links the data to the ODE model, and an MCMC approach was used to infer the parameter estimates described below. A fraction ρ of symptomatic cases are reported to the health system, and the delay from symptoms to hospitalization is used to infer the reporting parameter ρ. Since new hospitalization numbers appear to be underreported in Pennsylvania as well, the hospitalization reporting rate was also estimated. Although, our current statistical documentation is several weeks out of date, our general likelihood approach can be seen on our methods page.
Facebook mobility data were derived from mobile users with location tracking enabled. These were made available by the Covid-19 Mobility Data Network and they are presented here with a summary statistic describing the percentage of users that stayed home on a given day.
Results
In our model the daily β-parameters correspond to the population-level mixing or contact rates in the population, but note that these parameters only track transmission-capable mixing levels. In other words, if everyone wore a mask or face-shield and stayed >6 feet apart when interacting, the β-parameters would be inferred to be very low even if people were traveling or moving frequently. Posterior distributions for daily β-parameters were rescaled by the mean β-value between March 1 and March 11, representing the time period before any social distancting recommendations or requirements were put into place. Figure 1 shows the posterior distribution of all 130 relative mixing parameters from March 1 to July 7. As in analyses done for RI and MA, we see a substantial drop in population-level mixing from early March to early April, >80% reduced from baseline levels. As usual, the inference here cannot separate ‘number of human contacts’ from ‘infectiousness’. We assume that the observed drop in β is a result of lockdowns, school closures, and work-from-home policies; however as contact levels increased in late April and early May (yellow line, Figure 1), the inferred β-parameters may have stayed low due to improved hygiene and more cautious/distant mixing that would lower the infection probability per contact.
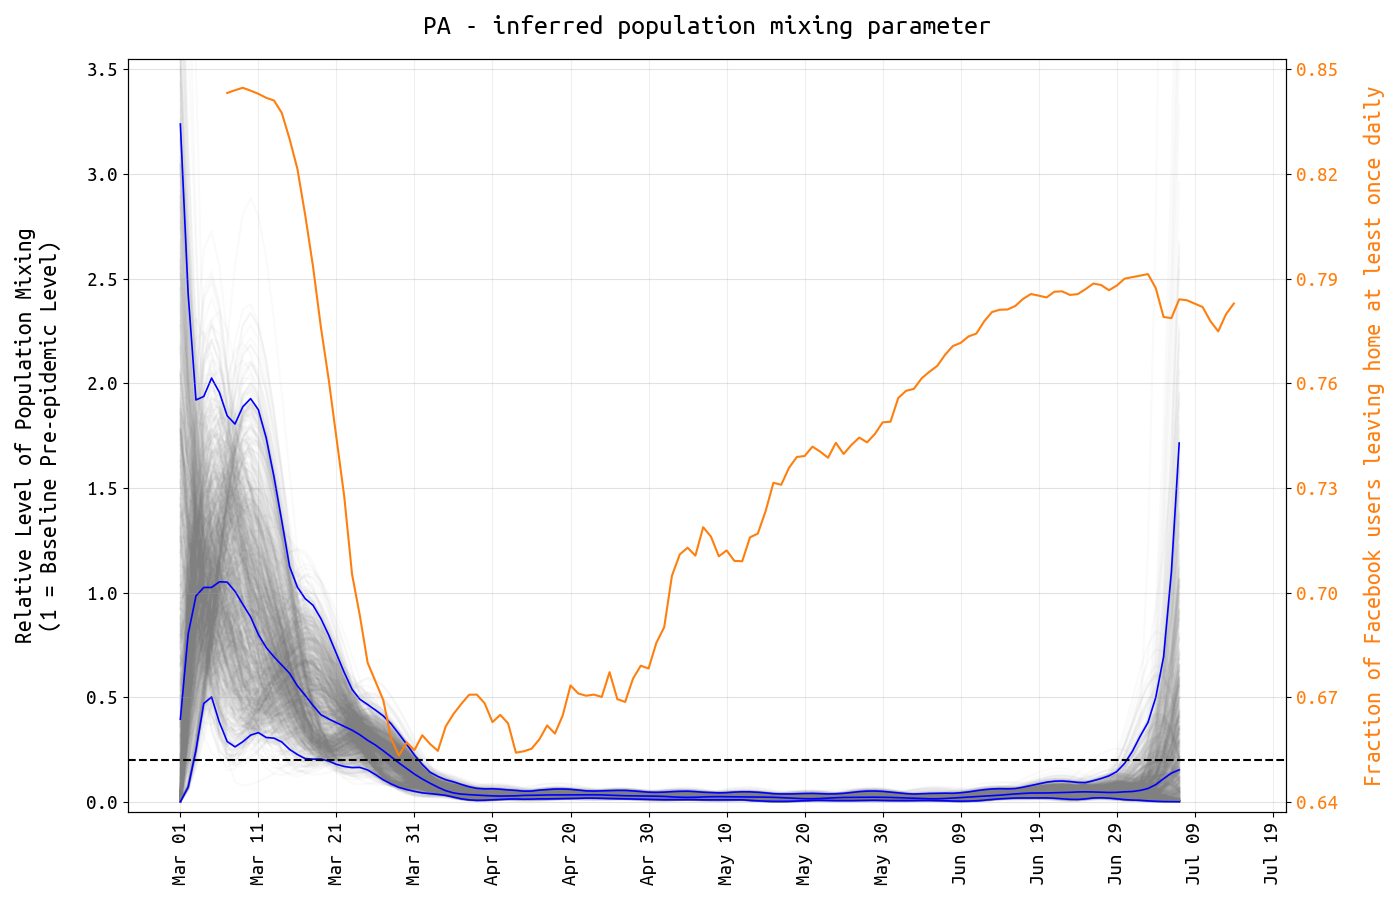
Figure 1. The y-axis shows the relative level of transmission-capable population mixing in Pennsylvania from March 1 to July 7. The level of mixing is shown with posterior distribution of daily β-parameters that represent mixing and social/physical contact in the population. The blue lines show the posterior median and 95% credible region, and the light gray lines show individual mixing time series drawn from the posterior. The mixing level is rescaled so that the mean from March 1 to March 11 is 1.0. The dashed line is drawn at 0.2. The yellow line shows the fraction of Facebook users in Pennsylvania that left home at least once per day.
All symptomatic cases of SARS-CoV-2 are not reported to the health system because (1) some people with symptoms stay home, (2) testing may not be available, and (3) some clinics or hospital systems may not be included in the state-level surveillance system. We estimate the underreporting factor by taking advantage of the fact that the delay from symptoms to hospitalization has been measured for COVID-19 cases. We estimate this delay at 3.2 days (95% HPD: 2.6-4.0) for Pennsylvania, and this results in a reporting rate estimate of 38.7% (95% HPD: 25.9% – 55.5%); in other words, more than 60% of symptomatic COVID19 cases in Pennsylvania go either unconfirmed or unreported to the health system.
In addition to the underreporting of cases, new daily hospitalization numbers are underreported as well. Underreporting of hospitalizations occurs for some of the same reasons as underreporting of cases. Lack of testing may be a reason, but the most likely cause is that on the day of hospitalization, the hospital either is not part of a reporting system or is not able to report the case on time. Current hospitalization numbers have proven to be more reliable in reporting complete patient counts of COVID19. Assuming that the ‘current counts’ are complete, the undereporting of daily case numbers can be estimated. We estimate that 48.2% (95% HPD: 28.9% – 74.2%) of newly hospitalized cases are reported to the health system. See Figure 2.
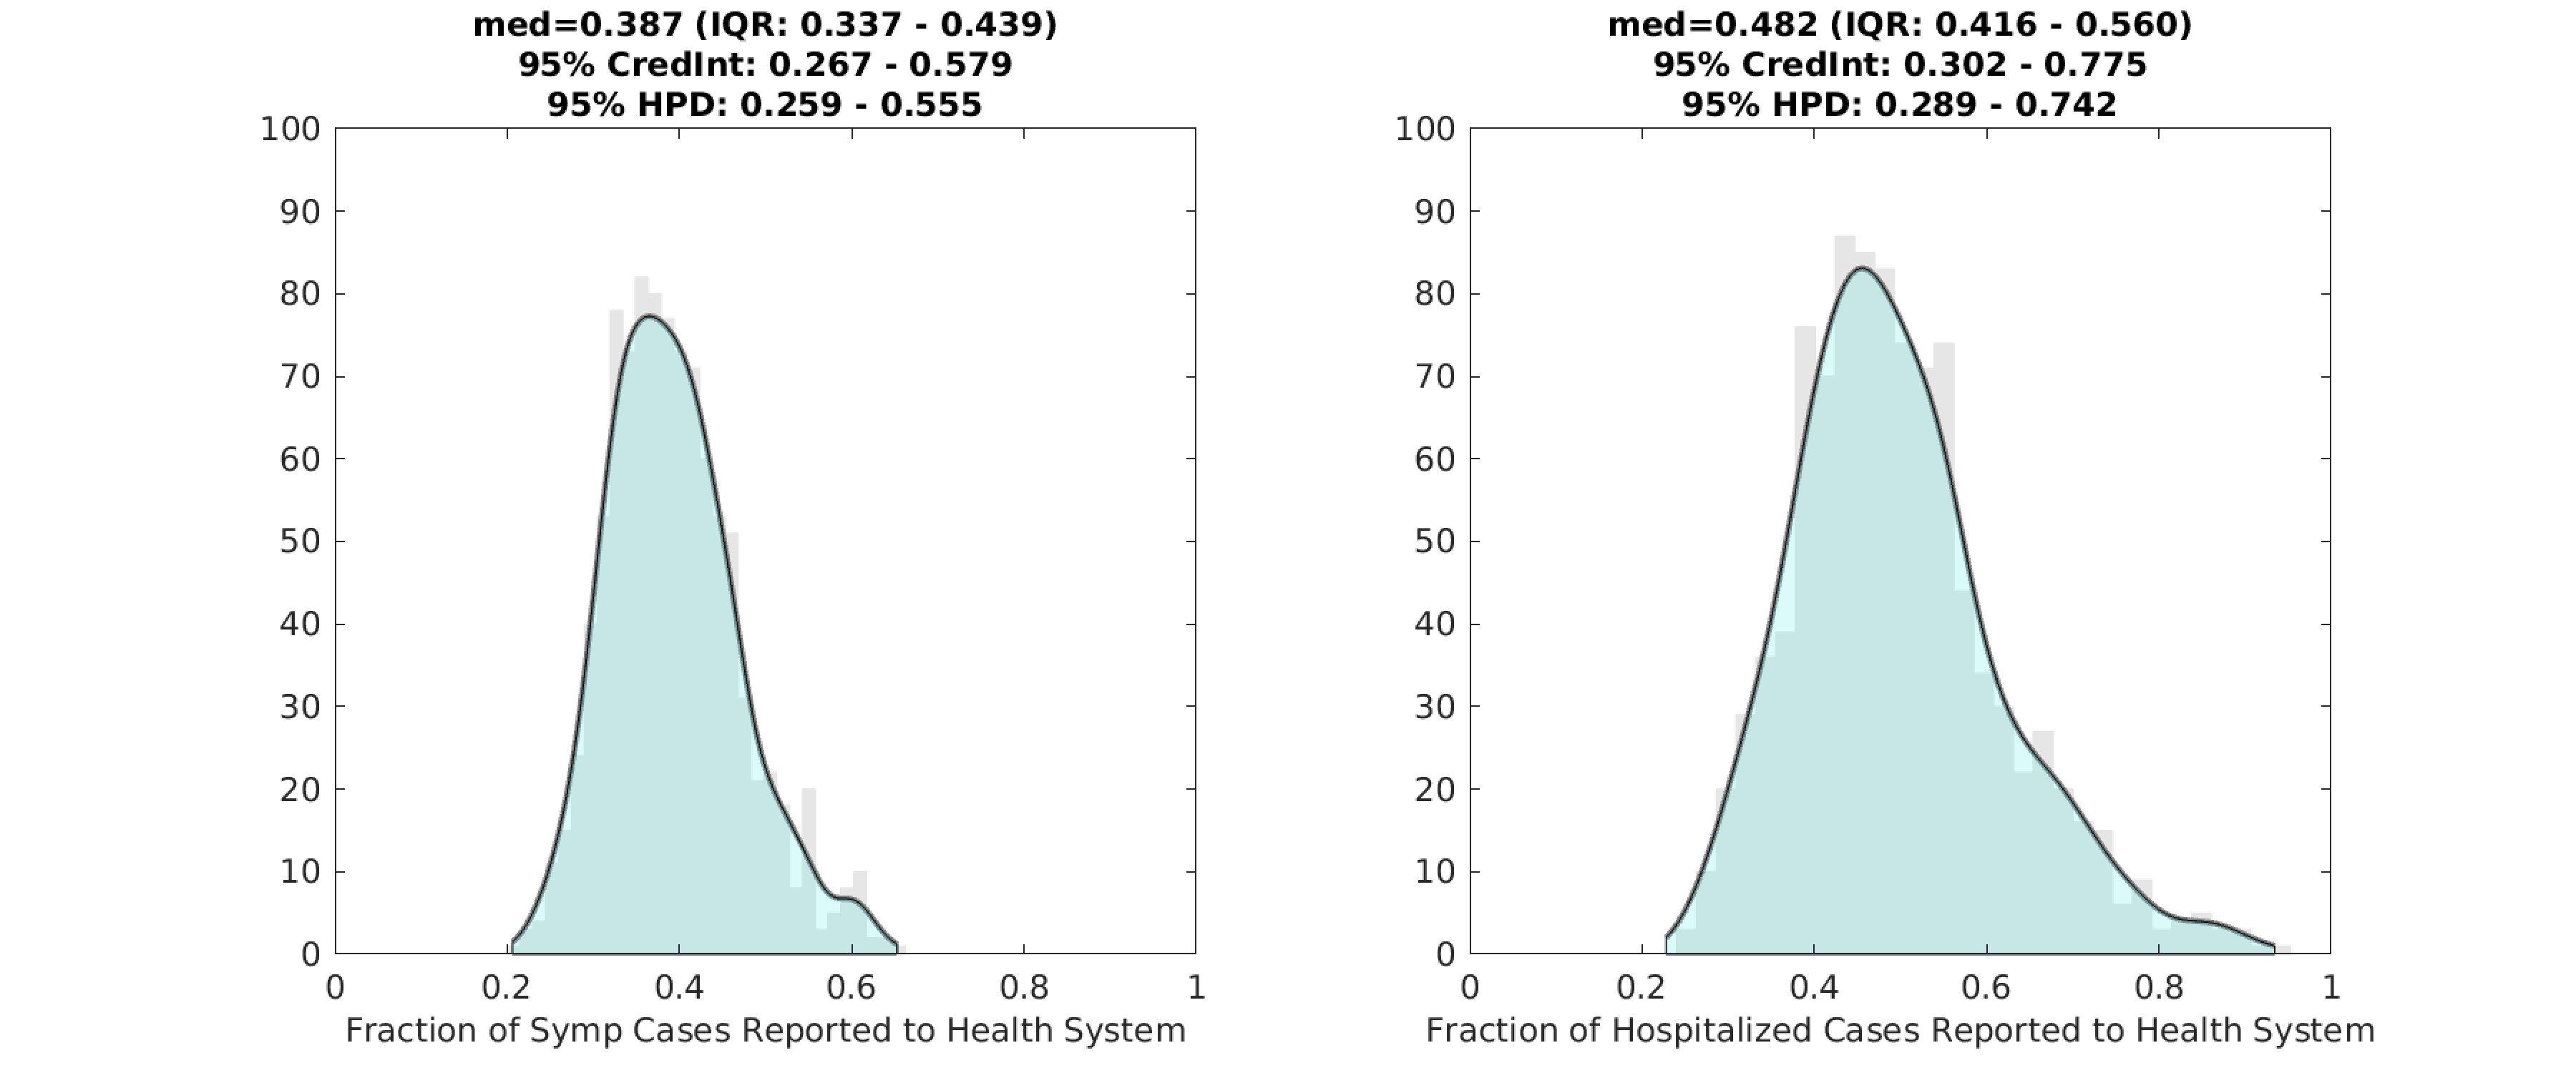
Figure 2. Posterior distributions for the symptomatic reporting rate ρ (left) and the fraction of new daily hospitalizations that are reported to the health system (right). Gray bar graph in the background shows a histogram of 1000 samples from the posterior, and the filled green area is a kernel-smoothed density function. Medians, credible intervals, and HPD intervals are shown above each plot.
Using the inference on the population’s symptoms reporting rate and estimates from the literature on the probability that certain age groups experience asymptomatic infection, we can estimate population attack rate (or seroprevalence) over the past four months of the epidemic in Pennsylvania. We estimate that by July 7, the total percentage of Pennsylvania’s population infected by SARS-CoV-2 was 3.27% (95% HPD: 2.41% – 4.42%). See Figure 3. A large proportion of these infections took place in April (about 1.46% of the state infected) and May (about 0.94% infected). In mid-March, case numbers were rapidly increasing but from a low starting point, so the total number of infections occurring in March was low. The rate of infection has slowed since the March/April lockdowns, and given current trends we may expect a 0.5% to 1.0% monthly attack rate for July and August, before schools open.
Estimating asymptomatic infection rates is one of the more difficult areas of epidemic analysis. Our current estimates, based on published studies, are that about 40% of cases are asymptomatic and that these numbers do not vary much by age except in the >80 age group (13% asymptomatic). However, there is a large amount of variation this group of published studies which are in general difficult to conduct and compare. Asymptomatic rates in children are especially difficult to measure since children are less susceptible to infection and since ‘undetectable viral load’ and ‘asymptomatic and PCR-positive’ may be difficult to distinguish for children participating in observational studies on asymptomatic infection. Using a different set of estimates on asymptomatic infection published by Davies et al, the asymptomatic fraction is closer to 60% and the numbers in Figure 3 below would need to be multiplied by a factor of about 1.5. We do not yet have statistical evidence showing that either 40% or 60% asymptomatic is more likely.
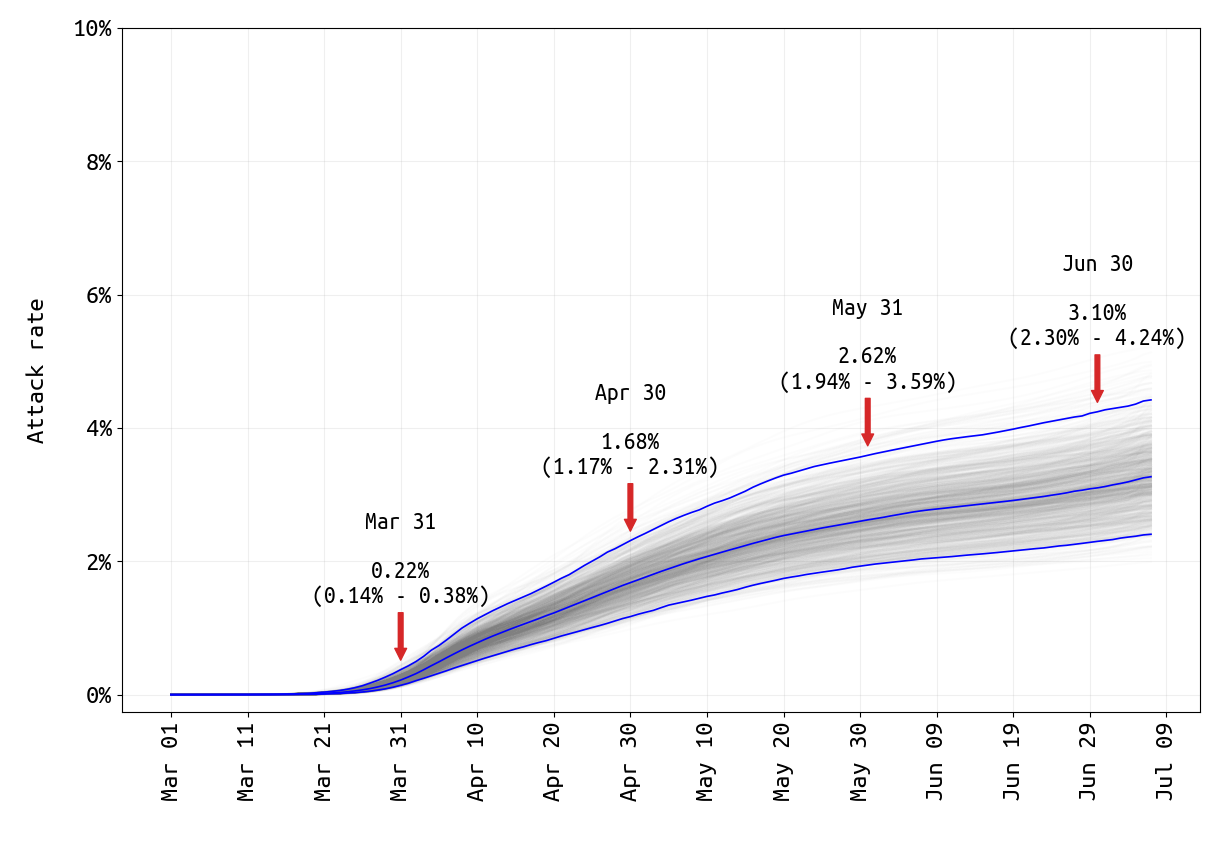
Figure 3. SARS-CoV-2 attack rate in Pennsylvania from March 1 2020 to July 7 2020. The attack rate is defined as the total percentage of the population infected and is very similar to the seroprevalence. The central blue line shows the median attack rate, while the outer blue lines demark the 95% credible interval of attack rates, based on 1000 draws from the joint posterior distribution of parameters inferred. The gray lines in the background show all 1000 seroprevalence trajectories. The median attack rate (and 95% CI) is shown for the end of each month in the plot.
Conclusions and Limitations
Like most state Departments of Health, data reporting in Pennsylvania has changed from month to month, with changing reporting definitions and certain data streams stopping and starting. New cases, new deaths, and current hospitalization counts have been reported regularly since mid-April and these three data streams do allow for inference to be performed on the overall size and burden of the epidemic thus far. Age-structured hospitalization data have not been available since mid-May, and age information for deaths is now reported weekly. There are also questions about double-counting (due to positive tests by serology being counted in the case total), but it is believed that this only represents a minor (<3%) total of the infection counts. We only use confirmed counts in the analysis to reduce the possibility of double counting and to maintain consistency for the entire 130-day time series analyzed.
Undereporting of COVID19 cases is a concern in all US states. Symptomatic reporting estimates are 50% and 90% in Massachusetts and Rhode Island, respectively, indicating that Pennsylvania (<40% symptomatics reporting) still has room for improvement in its ability to catch, report, and isolate cases. All of these numbers still need to be corrected for the fact that many states have active surveillance programs testing residents of nursing homes and health care workers. Once data like these are incorporated from PA and other states, reporting rates and perhaps reporting rates for different age groups will be able to be estimated more accurately.
With 88,691 cases reported by July 7, this translates to approximately 229,000 symptomatic cases when accounting for underreporting (95% HPD: 160K-340K). Including asymptomatic infection, the median estimate for the total case count is between 382,000 and 573,000, depending on whether we believe that 40% or 60% of cases are asymptomatic. This translates to an underreporitng factor of somewhere between 4 and 7, which is better than the early-March quoted range of between 5 and 20 (for the US as a whole). In March, with testing shortages and many DOH data programs still in their early stages of capturing data, it was believed that cases could have been missed at a much higher rate (e.g. 20-fold). The PA underreporting factor of 4-to-7 is in line with current observations in RI and MA.
Given these estimated median total infection numbers (382,000-573,000), the infection fatality rate (IFR) in Pennsylvania would appear to be between 1.2% and 1.8%, which like our Massachusetts estimate seems to be an overestimate. The full uncertainty range on the number of infections ranges from 266,000 to 856,000, which would mean that the IFR could be as low as 0.8%. Including active surveillance may also cause our estimate of ρ to drop, resulting in a lower IFR. This will be addressed in a subsequent analysis.
Updates and Corrections
No updates or corrections at this time.