November 10 2020
Attack Rate Analysis
Summary
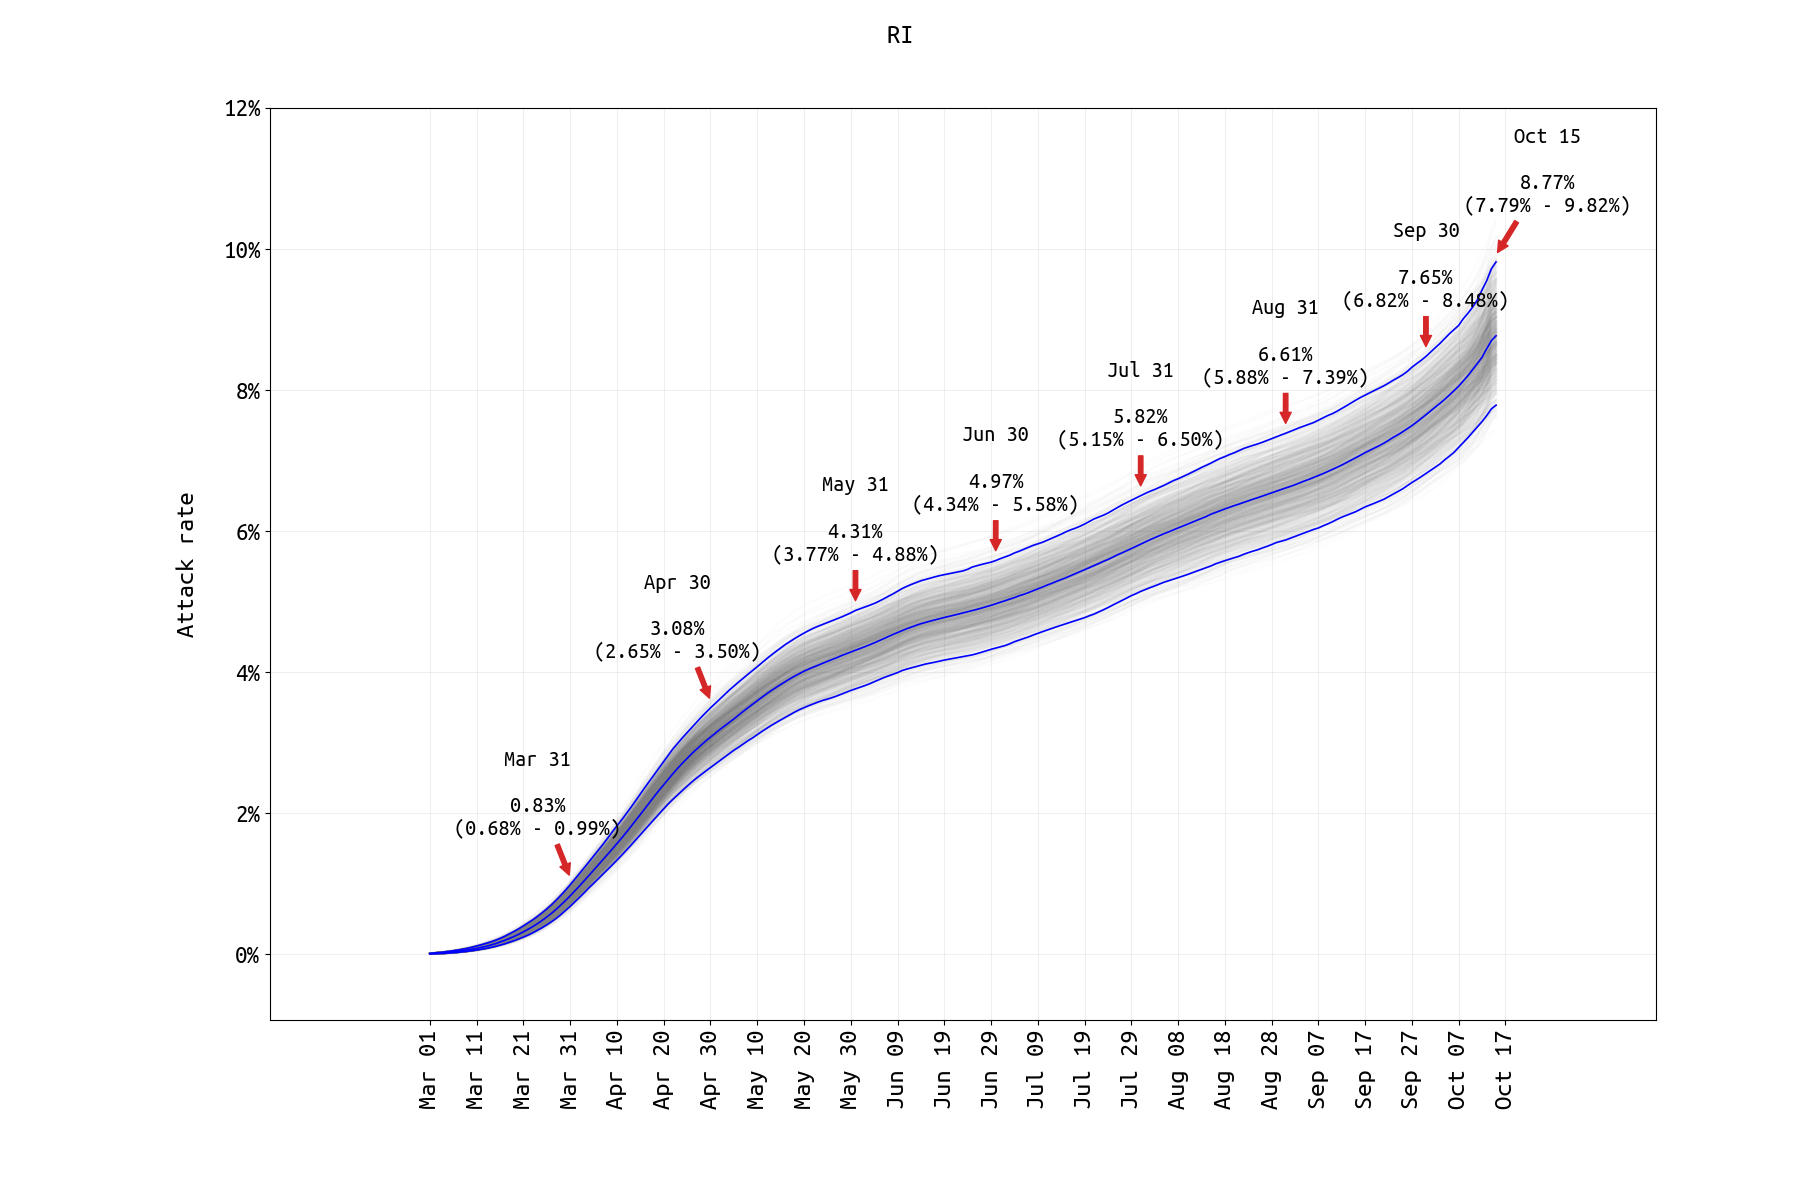
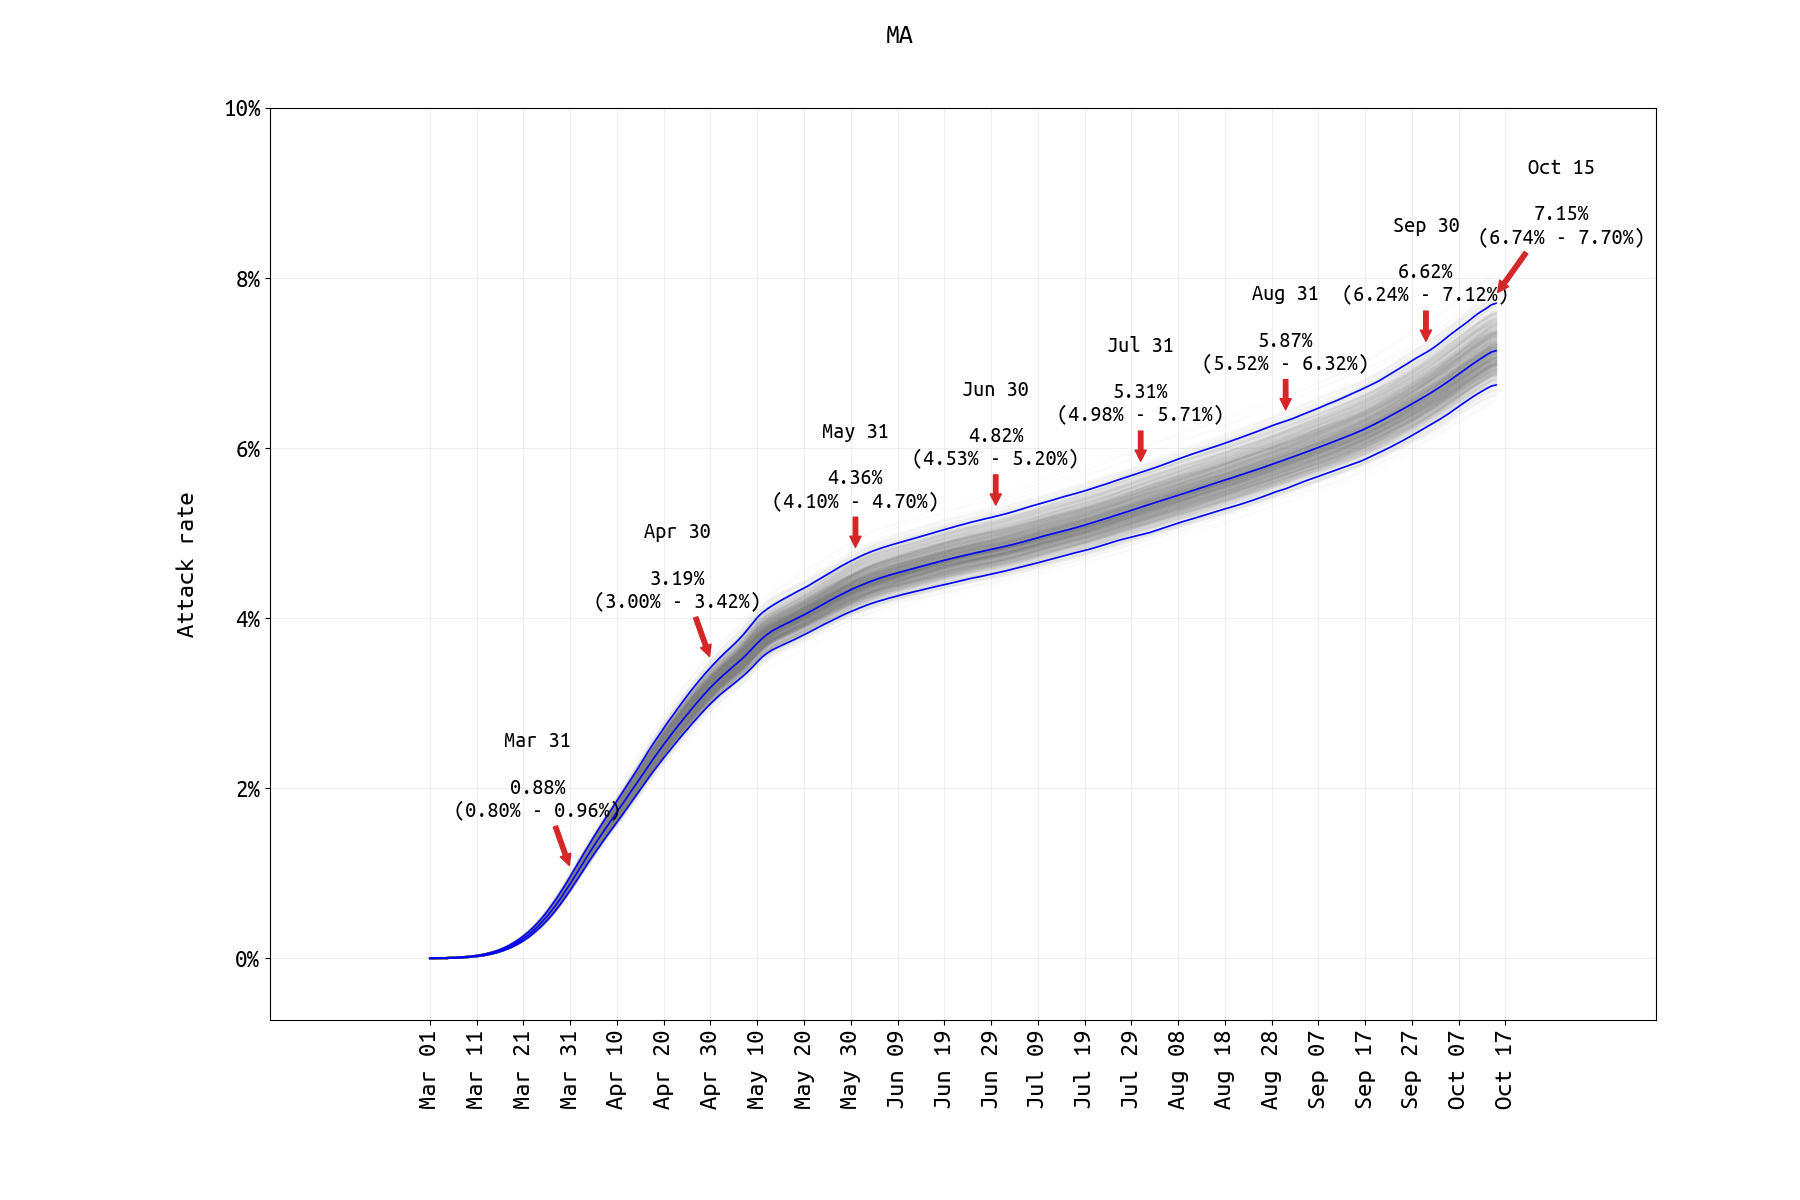
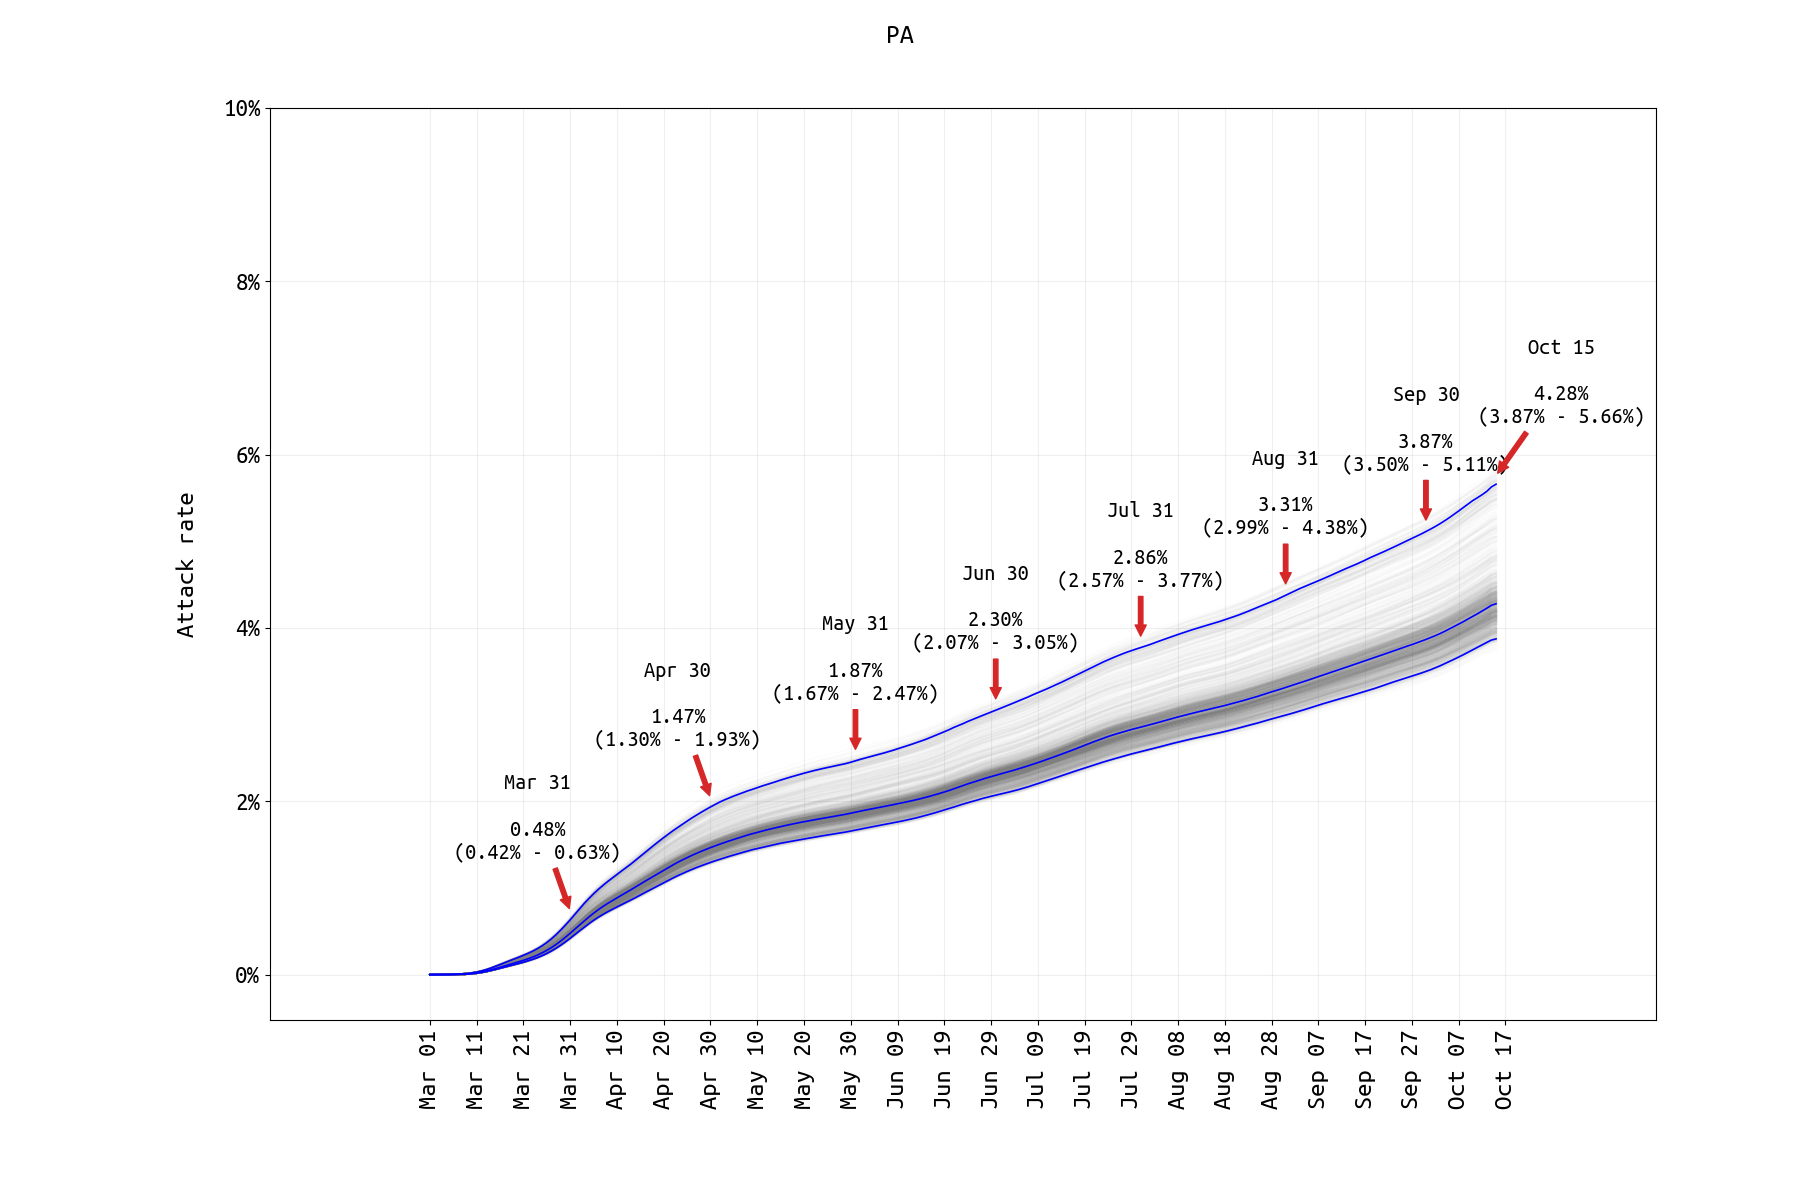
The graphs below show the SARS-CoV-2 attack rates in Rhode Island, Massachusetts, and Pennsylvania through October 15 2020. The attack rate is defined as the total percentage of the population infected, and it is a ‘month-early’ version of the seroprevalence time series. The analysis is based on data through Oct 21, so a patient presenting with symptoms on Oct 21 is included and counted as having been infected on Oct 15 (mean incubation period is six days). The central blue lines show the median attack rate, while the outer blue lines demark the 95% credible interval of attack rates, based on 1000 draws from the joint posterior distribution of all parameters inferred. The gray lines in the background show all 1000 trajectories. The median attack rate (and 95% CI) is shown for the end of each month in the plot. In the Bayesian inference analysis, we used case, hospitalization, and death time series, and the age-specific asymptomatic fractions in the Davies et al paper.
Attack Rates through October 15

Figure 1. SARS-CoV-2 attack rate in Rhode Island from March 1 2020 to Oct 15 2020. Model assumes that age-specific mixing rates changed in May 2020 and that the rate of ICU admission dropped in May/June 2020 (both supported by lower DIC). A prior-distribution constraint was used to ensure that Oct 15 case numbers and model output were within 10% of each other. A big jump in infections occurred in October, and the attack rate is likely to get to 13% by the end of November.

Figure 2. SARS-CoV-2 attack rate in Massachusetts from March 1 2020 to Oct 15 2020. Model assumes that age-specific mixing rates changed in May 2020 and that the rate of ICU admission dropped in May/June 2020 (both supported by lower DIC). A prior-distribution constraint was used to ensure that Oct 15 case numbers and model output were within 10% of each other. For the past two posts, the cumulative hospitalization data have been removed from the Massachusetts analysis (as these data on the MassDPH website represent a subgroup of a followed cohort, and not all reported hospitalizations from a group of hospitals). The reporting rate is estimated by ensuring that the symptomatic case data and the ‘current hospitalizations’ data streams are both fit well, however this fitting requires that we know the duration of a typical medical-floor level hospital stay (assumed to be 11.8-12.8 days here), and it relies on on having tight prior bounds on the age-specific hospitalization probabilities. Here, we assume that Massachusetts has nearly the same age-specific hospitalization probabilities as Rhode Island. As in Rhode Island, the curve is turning sharply upward. The likely attack rate by end of November will be close to 11%.

Figure 3. SARS-CoV-2 attack rate in Pennsylvania from March 1 2020 to Oct 15 2020. A prior-distribution constraint was used to ensure that Oct 15 case numbers and model output were within 10% of each other. Hospitalization fits were difficult for PA data as new hospitalization data are only available through the second half of May and ICU counts are not available. Model assumes that age-specific mixing rates changed in May 2020 and that the rate of ICU admission dropped in May/June 2020 (both supported by lower DIC).