- About Δ m, n, 2
- Input by Uploading a Text File
- Input by Typing a Character Sequence
- Input by Providing m, n, k Values
- Input by Uploading a Triplet of Nucleotide Sequences
- How to Cite Δ m, n, 2
Non-parametric test for clustering in a sequence of binary outcomes
The Δ m, n, 2 statistic on this page allows you to test for clustering of binary outcomes in a sequence. This test can be thought of as a test of clustering in one-dimension or a rank test of clustering.
As an example, if you start with this sequence of binary outcomes

which has exactly m = 30 red bars and n = 30 blue bars from left to right, you may want to answer the question whether the red and blue bars are randomly arranged or not, given that there must be 30 of each. One way to test this is with a Mann-Whitney U-test, also called a Wilcoxon rank-sum test. This test will tell you if the rank of the blue outcomes is significantly greater than the rank of the red outcomes, or vice versa. Essentially, you will be able to determine if one type of outcome clusters on the left-hand side or right-hand side of the sequence. Another way to test this will be with the Δ 30, 30, 2 statistic, whose exact distribution depends on how many red and blue bars there are (see footnote(a) for the meaning of the "2" subscript). The above sequence appears to have a random arrangement of reds and blues.
The sequence below

seems to have clustering of blue bars on the right-hand side (Mann-Whitney p = 2.01 × 10 −4 ).
However, this sequence

does not show a significant rank difference among reds and blues (Mann-Whitney p = 0.80) because the clustering occurs in the middle of the sequence. A new statistic is needed to determine if the red bars above are clustered within the sequence of blue bars.
To construct this new statistic, we borrow from the theory of stochastic processes and define a random walk that follows the order of the blue bars and red bars. For every blue bar, the random walk takes a step up. For every red bar, the random walk takes a step down. Going back to our first example, the random walk and the sequence together look like this:
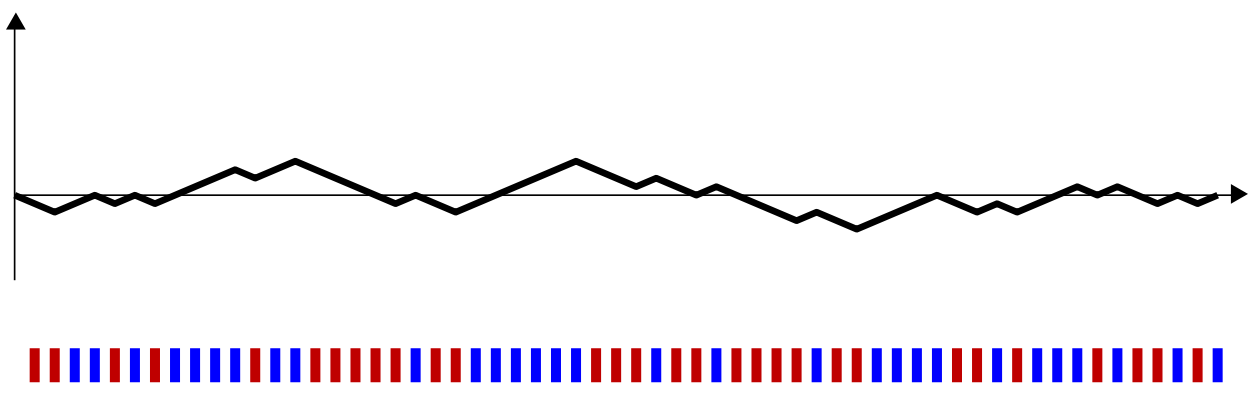
You can see that when the sequence of reds and blues is truly random, the walk never gets too far away from the horizontal axis.
Looking at our third example, where all of the red bars cluster perfectly in the middle
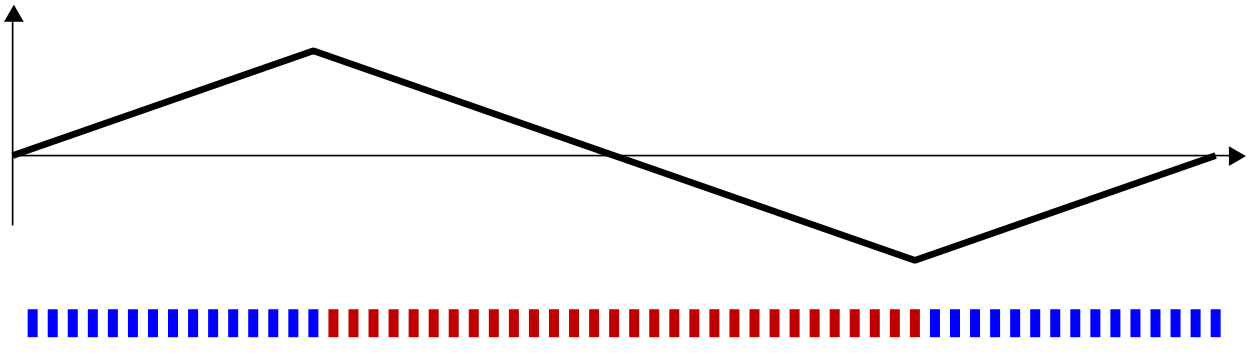
we see in the random walk that there is a descent of 30 steps in the middle of the walk. If these bars had been arranged at random, there would be about 1.2 × 10 17 possible arrangements, with only 31 of these arrangements having a descent of 30 steps. Thus, the chance that a descent of 30 steps occurs at random is approximately 2.6 × 10 −16 . This case is an easy one to identify as non-random, and we conclude that the red and blues were not ordered randomly. See footnote(b) on maximum ascents.
Our test statistic above is the maximum descent in the walk, which is 30, i.e.
Δ 30, 30, 2 = 30
And we write that
P ( Δ 30, 30, 2 = 30 ) = 2.6 × 10 −16
or
P ( Δ 30, 30, 2 ≥ 30 ) = 2.6 × 10 −16
since a descent of 31 steps or more is not possible.
Of course, all of the interesting cases occur with some noise. Let’s take a look at this sequence of reds and blues below.
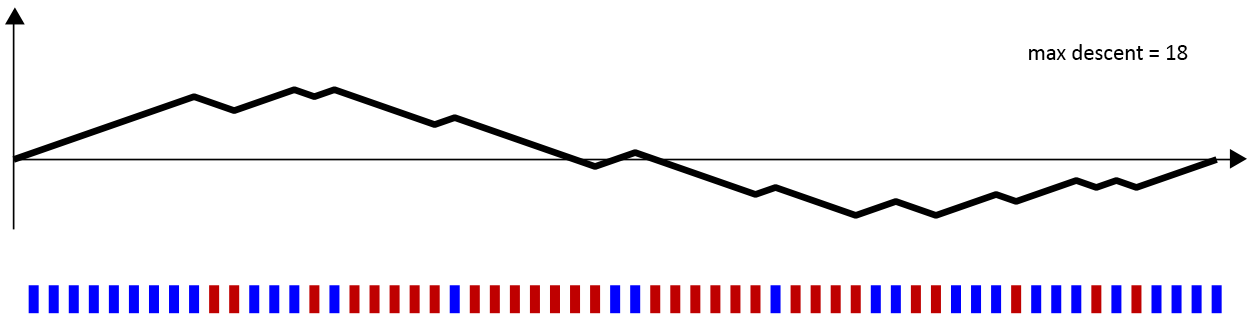
Again, we have 30 red bars and 30 blue bars. And, it does appear that the blues cluster on the left and right, while the reds cluster in the middle. The maximum descent in the above walk is 18 units: at one point, the walk falls from 10 units above the axis to 8 units below the axis. Hence,
Δ 30, 30, 2 = 18
The calculator on this page computes the exact probability(c) of situations like the one above. If you have a random walk with exactly 30 up-steps and 30 down-steps, the calculator will give you the probability that at some point in the walk there is a descent of 18 steps or more.
In other words, you will be computing
P ( Δ 30, 30, 2 ≥ 18 )
Try this out yourself. You should get a p-value of about 1.73 × 10 −4 . This means that if you were to arrange 30 red bars and 30 blue bars at random in a sequence, there is only a 1.73 × 10 −4 probability that this sequence would show the red-clustering that you see above.
(a) You may have noticed that the subscript “2” is not used for anything in the description of Δ m, n, 2 . This “2” simply means that when these red-and-blue sequences are interpreted in the context of nucleotide sequences and recombination, they allow you to compare the alternative hypothesis of 2-breakpoint recombination versus the null hypothesis of clonal evolution. Equivalent statistics can be defined for 3-breakpoint recombination (Δ m, n, 3 ) and 1-breakpoint recombination (Δ m, n, 1 ), but these have different clustering interpretations than the one presented here.
(b) You can also compute the probability of a maximum ascent in a random walk (technically, a hypergeometric random walk). The math is exactly the same, as all you need to do is switch the reds and the blues and compute the probability of a maximum descent. You will see a 'swap' button in the calculator that allows you to do this. What we are not able to compute quickly is the probability that a hypergeometric random walk contains either a descent of greater than k or an ascent of greater than k.
(c) Approximate probabilities are also presented for comparison. These are the continuous and discrete approximations as presented in Hogan and Siegmund (1986).